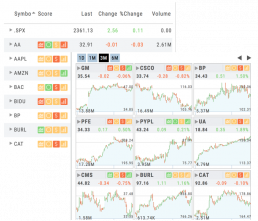
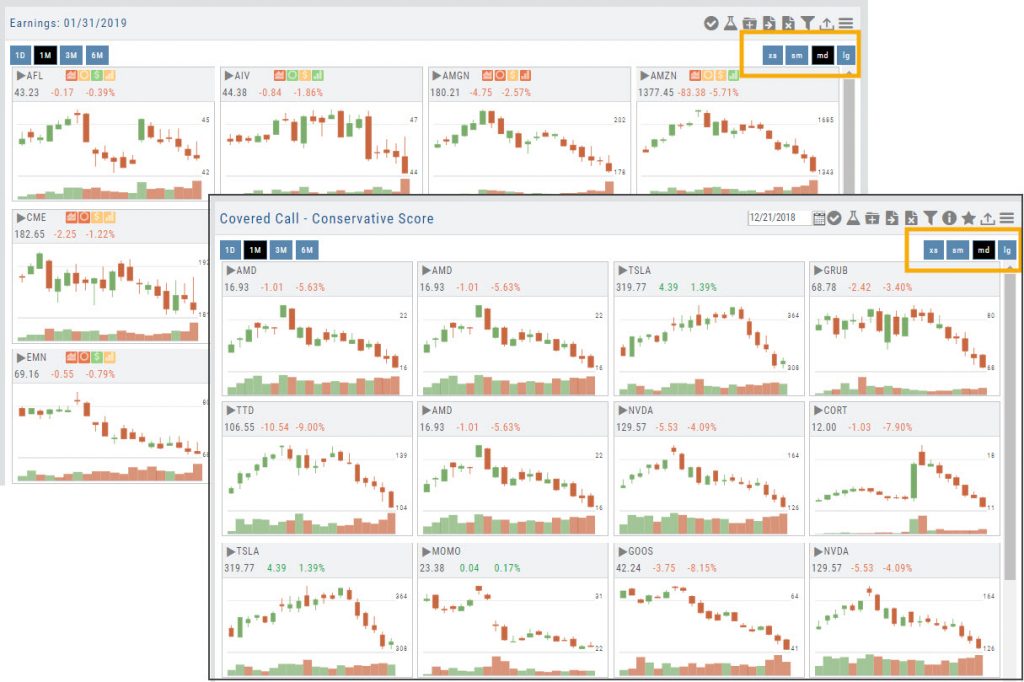
Tile View Sizes
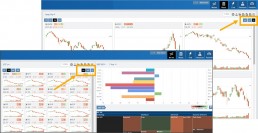
Tile View is available in 3 sizes on the Market or Watch Tabs.
Scans and Earnings/Dividends Calendar under the Find tab offer 4 Tile View sizes: Extra Small to Large.
The platform’s adaptive and responsive technology will automatically adjust the number of tiles shown based upon the available space as well as allow continual scrolling for large lists.
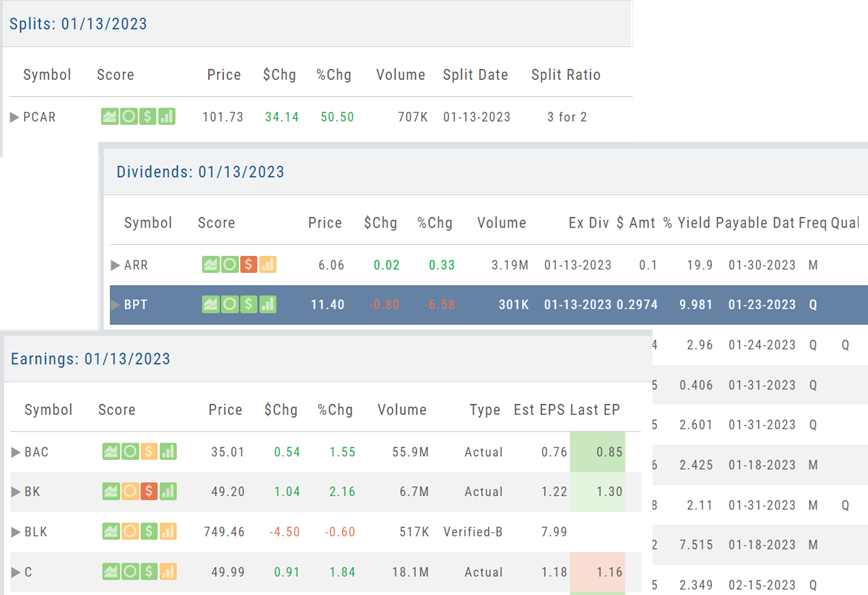
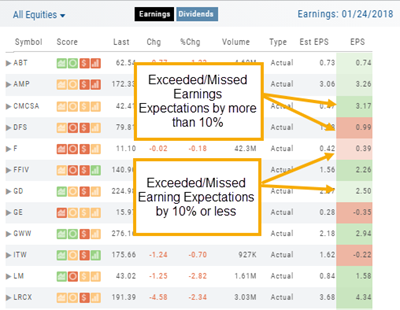
Earnings Per Share Performance
Once a date has past and earnings have been announced, Earning Per Share (EPS) is color-coded based on how much the company beat (or missed) Expectations.
Go to Find>Calendar, select “Earnings” and view any past date, where earning have been announce, to view the results.
Dark Green/Dark Red is considered surprise, and indicate the company beat/missed estimates by more than 10%
Light Green/Light Red indicate the company beat/missed estimates by 10% or less
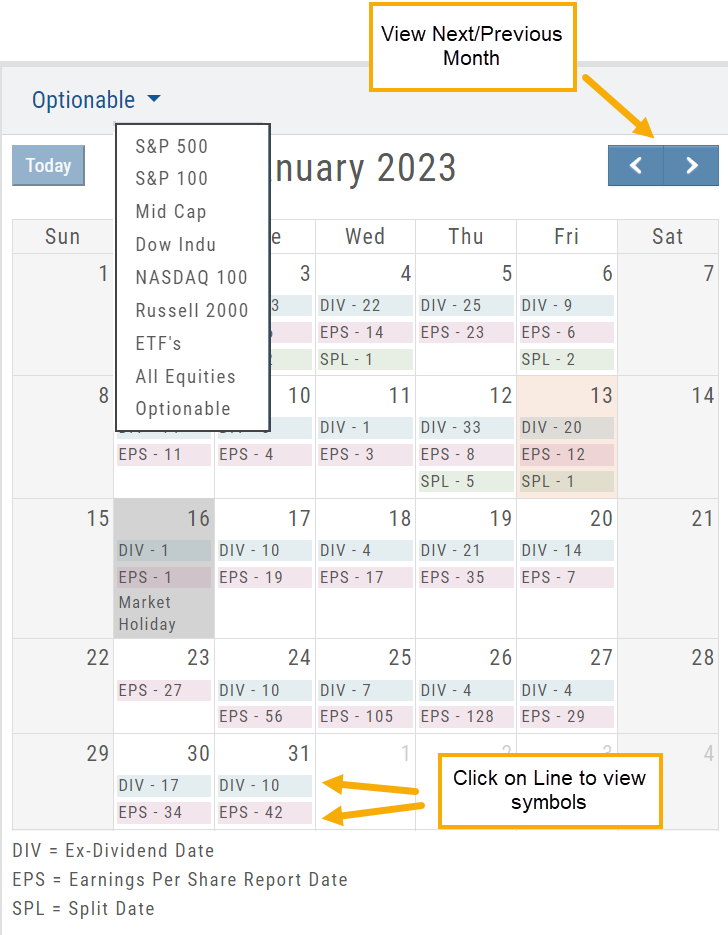
Calendars
Under the “Find” Tab, Calendar allows one to search for company’s Dividends, Earnings or Splits.
Select “DIV”, “EPS”, “SPL” by calendar date. Use the drop-down menu on the upper left corner to select S & P 500 stocks, All Equities, Optionable, etc.
Use the navigational buttons on the upper right, above the calendar to move the time period forward or back.
Once selected, the stock symbols will automatically populate the right side of the screen. The navigational icons, allow you to perform such functions as select/adding/managing icons to send to a Watchlist or to Research, you can also further Filter candidates.