26-06 Release- Bid/Ask Percent Data
Bid/Ask Spread – Premium Percentage
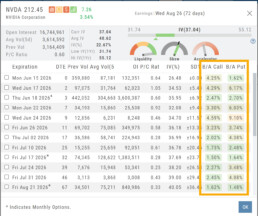
What do these columns represent?
The values represent the Bid/Ask spread percentage for the At-The-Money strike for each Expiration.
The percentage background color ranges from green, gray, yellow, and red, which represents the most liquidity to least for that ATM Expiration
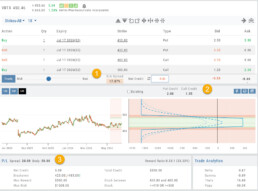
Spread Trade example:
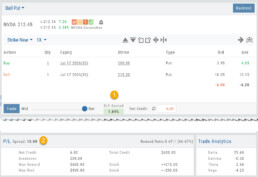
Bull Put
1. The negotiation slider dynamically calculates the percentage of the position premium (debit or credit) that the bid/ask spread comprises when the slider is moved between the Mid (0.00%) and Natural (Max %).
2. This value confirms the Spread value. In this example, the value is 15. The strikes are 200/215:
Multi-Leg Example:
Iron Condor
1. The negotiation slider dynamically calculates the percentage of the position premium (debit or credit) that the bid/ask spread comprises when the slider is moved between the Mid (0.00%) and Natural (Max %).
2. The Put/Call Premium is calculated and tied to the “Bid”.
3. The Outer legs and Body spread values.
Change Log
- ADUR display resolved
- Repaired snap quote issue with Tradier
- SPLG>SPYM display data corrected
26-06 Release Notes: Bid/Ask data
Bid/Ask Spread – Premium Percentage
What do these columns represent?
The values represent the Bid/Ask spread percentage for the At-The-Money strike for each Expiration.
The percentage background color ranges from green, gray, yellow, and red, which represents the most liquidity to least for that ATM Expiration
Change Log
- ADUR display resolved
- Repaired snap quote issue with Tradier
- SPLG>SPYM display issue corrected
Price Slices - Premium Feature
Price Slices
Price Slices allow users to view theoretical outcomes of option positions, while providing the flexibility of changing data points, such as entry price or what the results will be if the stock price moves a specific dollar or percentage amount.
This feature is helpful with building discipline on when to exit a trade if it goes against you.
This feature is accessible when using the Strategy Templates on the Research>Option Tab
The default starting points include:
- Entry Point – shown in Blue in our example.
- High Point – considered Target or Resistance point – shown in Green.
- Low Point – considered Stop or Support point – shown in Red
(Up to 7 Price slices can be added for additional evaluation. See below for more details)
On Research>Option Tab, click the down arrow next to the default “Call+Put” view in the upper left corner of the window to access the Strategy Templates:
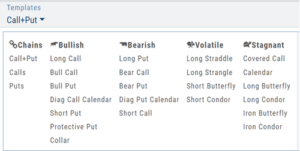
Select your Strategy and set up the position:
Quantity, Expiration Date, Strikes
On the right side of the same screen, click the ![]() button to display the default settings.
button to display the default settings.
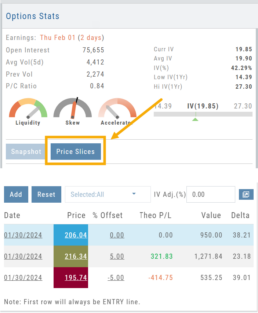
Using our example:
Entry point is $206.04 (Current Stock Price) shown in Blue
High point – defaults to 5% above Entry: $216.34, shown in Green/Gold
Low point – defaults to 5% below Entry: $195.74, shown in Red
The values are for ‘today’: what the Profit or Loss would be if the stock price were the High or Low price.
The Date, Price and/or % Offset can be manually adjusted, as indicated by the underline – to view different scenarios.
Price Slices – Adjust the % Offset Value
% Offset values were manually changed to 10% and -10%.
The lines on the graph are dynamically updated
Price Slices – Adjust the lines
In this example, the Top and Bottom lines were adjusted on the graph itself.
The new placement dynamically updated the values on the right.
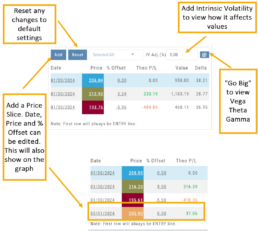
Price Slices – Add, Reset, Go Big
Platform Features Release: Trade from the Chart, Price Slices, Reset Virtual Account Options
Announcing the latest Release of feature and functionality enhancements to the trading platform to improve the position evaluation process, trade submitting process as well as offer additional practice account settings:
Price Slices: Evaluate theoretical outcomes of option positions when using the Strategy Templates.
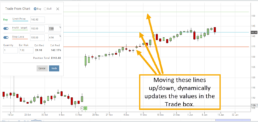
Trade from the Chart: Use the control box or lines on Chart to adjust the entry point, Target Price and/or Stop Price.
Reset Virtual Account – Add ‘funds’ to an existing account OR reset everything and start fresh. You decide.
Price Slices (Premium Feature)
The ![]() Button appears on the right side of the screen when using the Strategy Templates.
Button appears on the right side of the screen when using the Strategy Templates.
Select one of the 22 Option Strategy Templates.
Build the position.
Click the Price Slices button to start your evaluation
Change the Date (default ‘today’), Price levels and/or % Offset
Add IV to view how this affects the theoretical P/L
Click the Go Big icon to view additional Greek data
Trade from the Chart
The ![]() button appears at the top of the chart for any symbol – whether there is an existing position or not.
button appears at the top of the chart for any symbol – whether there is an existing position or not.
Clicking this button activates an Order Window on the Chart, like this:
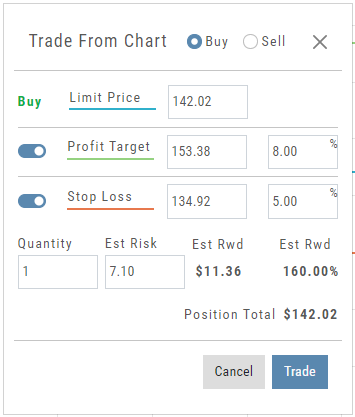
Note: Buy, Profit and Stop Loss line colors will match those displayed on the chart itself.
The values in the Order Window can be manually adjusted by $ or %
The values can also be dynamically adjusted by moving the corresponding line(s) on the Chart itself.
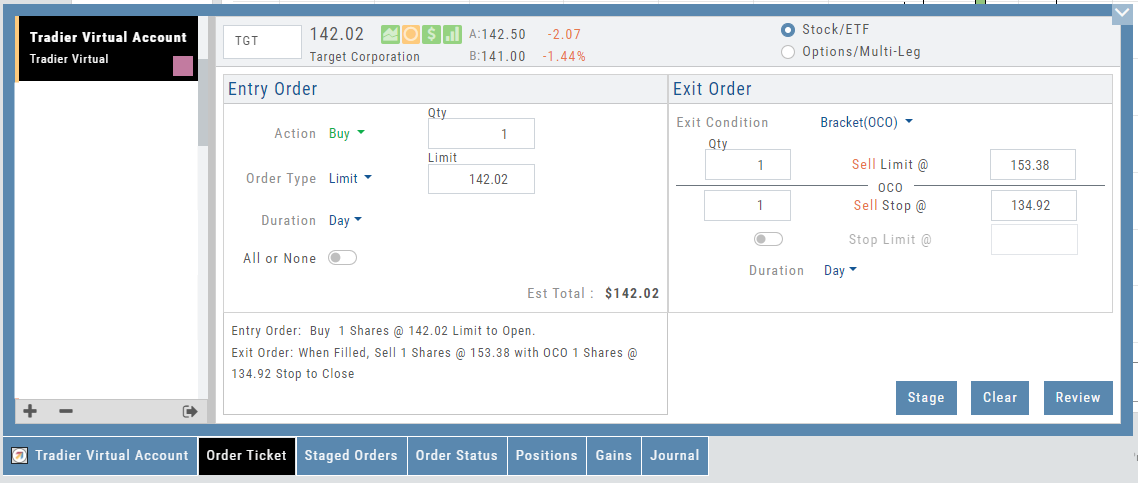
The Quantity value default is “1” to show the ‘per share’ dollar and percentage estimated risk, reward, as well as Position Total.
Click “Trade” for the prefilled Order Ticket to display.
The Order Ticket can be further adjusted, Staged or Reviewed to ensure it’s completed to your satisfaction, then Submitted.
Note: The brokerage selected must support Bracket Orders if the Stop/Stop Limit values are selected on the Order Window
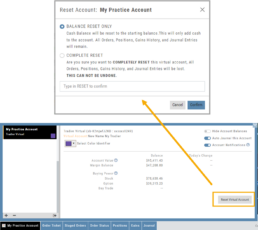
Reset Tradier Virtual Account – 2 options
Tradier’s Virtual Account gives you the ability to add more “Cash” to your practice account – OR – completely start over:
On the account summary page, click “Reset Virtual Account”
Select “Balance Reset Only” – to keep your existing trade activity, but add more “cash” to your virtual account.
Select “Complete Reset” – if you want to remove all prior transactions, including Journal Entries, Gains, Orders, Positions, etc. Note: This selection cannot be undone once it’s processed.
Type RESET in the box provided, then click the “Confirm” button
Enhancements
- ATM Option Strikes are bolded for easier identification
Change Log
- Adjusted theme contrast
- Corrected Order Type Limit price entry
- Snapshot functionality restored
Platform Features Release: New Option Chain Functionality/Appearance, Responsive P/L Graph
Features Release Notes:
New Option Chain Functionality/Appearance, Responsive P/L Graph
Announcing the latest features/functions updates, additions or edits to the trading platform:
Option Chain Functionality/Display has been revamped to allow users to control which information to view and increase responsiveness. Symbols, such as SPY and SPX, will load noticeably faster. An incorporated Dashboard provides a snapshot of current activity allowing users to make more informed decisions.
Responsive P/L Graph adjusts when the slide bar between Bid and Mid price is adjusted. This is especially helpful when the spread is considerable.
Option Chain Display/Functionality
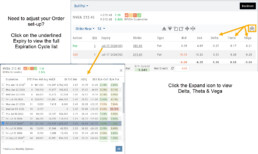
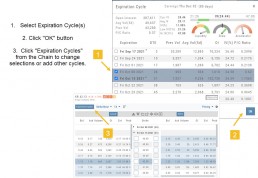
Select Expiration Cycles
The redesigned Option Chain allows users control of what Expirations to view instead of the platform defaulting to a cycle approximately 30 days out.
Click on the Options Tab from Research.
A window with available Expirations will appear along with a Dashboard with pertinent information (Volume, IV, OI, Earnings Date, etc) for more informed decision-making.
As a bonus, this structure allows data to load faster – especially helpful for those symbols with large option chains.
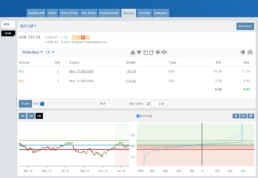
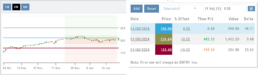
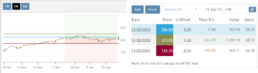
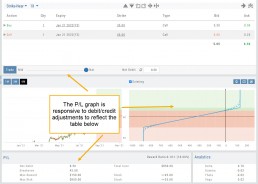
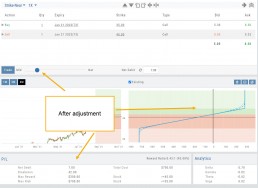
Responsive P/L Graph
The P/L graph on the Options Tab is responsive to adjustments made to the trade set up for the entry Net Debit/Net Credit.
Note, the smaller the spread between the Bid/Ask, the smaller the graph adjustment will be.
The example illustrates a large spread to better illustrate this feature update.
Change Log
- Price representation on chart X/Y axis corrected
- Journal Notes enhancement
- Saved screeners adjustment
- Active Watchlist access corrected
- Close from Backtest saves Symbol
- Clarified wording on Warning Message
- Mobile version of Saved and System Screener
- Mobile app – rolling trade adjustments
- P/L ‘Go Big’ data correction
- Account Summary page enhancement
- Large number displays on HeatMap
Intraday Trade Finder Scan Updates (Premium Desktop Feature)
Trade Finder Scans are updated every 30 minutes during Market Hours on the Premium Platform. That’s 12 more times than the Standard Platform version, which updates once after the Market opens.
Trade Finder Scans are easily identified with a Rocket Icon in the upper left corner of the Scan box.
Strategy Template
A Strategy Template provides a shortcut to quickly create an option strategy, virtually eliminating structure errors. Once selected, you can modify the structure within the template using the tools on above the option tables: Moving Strikes up/down, rolling Time out/in, widening or narrowing Strikes.
![]()
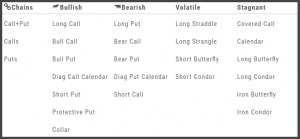
Some strategies can be changed from all Calls to all Puts (and vice-versa).
Note: The templates will not allow you to exceed certain parameters, as attempting to do so would result in an invalid strategy. This is a built-in safety net and you would receive a notice similar to:
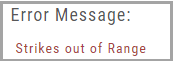
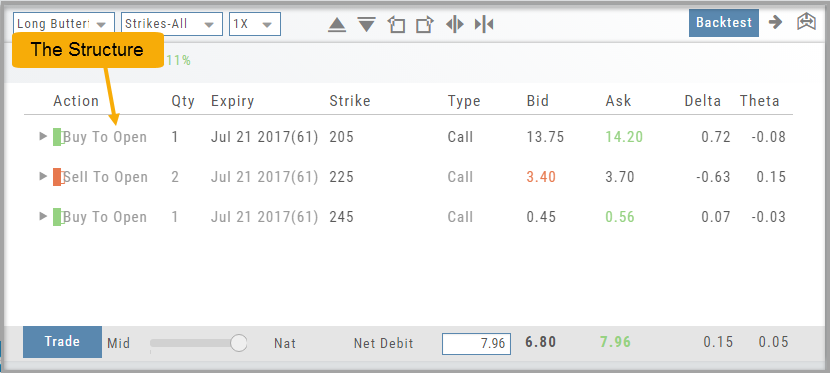
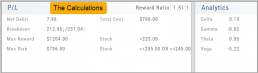
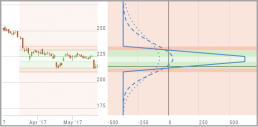
Storyboard of the Strategy
We also display a storyboard-like view of the selected strategy. It is a combination of chart, risk graph, and performance channel constructed within one panel.
This storyboard gives you the full picture of the position: The Structure, Performance Channels and Calculations.
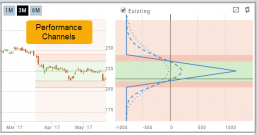
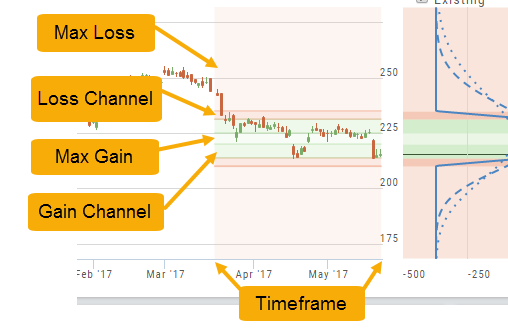
Performance Channels
Performance Channels can assist in visual analysis across both the P/L Graph and the Chart.
- Dark Green – Stock movement affects gain
- Light Green – At maximum gain
- Dark Red – Stock movement affects loss
- Light Red – At maximum loss
The width of the channel on the chart represents the timeframe of the trade. If options expire in 30 days, the channel will display back 30 days on the chart. This give a visual reference for the time frame of the trade.
Note: Channels are displayed based on expiration of the trade. Past performance is not indicative of future results. Performance channel date orientation is for reference only.
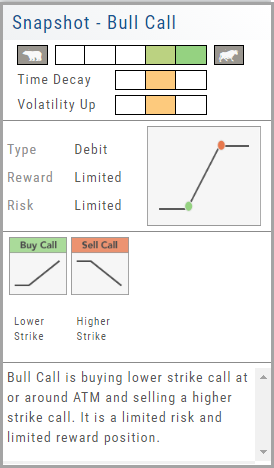
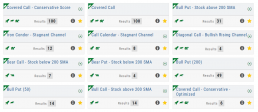
Strategy Snapshot
It’s the “Cliffnotes” version of your strategy
Each strategy template provides a quick reference for the construction and application of the strategy. The snapshot shows:
- what the strategy outlook is on the color-coded range from ‘Very Bearish’, ‘Mildly Bearish’, ‘Neutral’, ‘Mildly Bullish’ or ‘Very Bullish’.
- what effect ‘time decay’ and ‘volatility’ has on the strategy: ‘Increase’, ‘Neutral’ or ‘Decrease’.
- debit or credit trade
- risk & reward level
- strategy structure
- an overview summary of the strategy