
26-11-11 Release Notes: Ctrl + Scroll Zoom
TradeTool Platform
Release Notes
You can now zoom any chart by holding Ctrl and rolling your mouse wheel. No range menu needed.
Also new: two chart styles, Heikin Ashi and Hollow Candles, plus a Measure tool that shows price, percent, time and bars between two points.
TradingBlock users: Stop and Stop Limit orders show the right prices on the chart, and option chain Volume fills in during market hours. Plus a few chart fixes (full list below).
Ctrl + Scroll Zoom on Charts
Hold Ctrl and roll your mouse wheel over a chart to zoom in or out. You no longer have to switch ranges or drag the navigator to get a closer look at recent price action.


How to use it
- Open a chart (Research → Chart).
- Move your mouse over the price chart.
- Hold Ctrl and roll the wheel to zoom in or out.
- Let go of Ctrl to scroll the page as usual.
- Click Reset Zoom in the chart toolbar to go back to the full range.
Why Ctrl?
The chart only zooms while Ctrl is held down, so you won't zoom it by accident while scrolling past it.
Heikin Ashi and Hollow Candles
Two new chart styles are in the chart type menu, next to Candlestick, OHLC and Line.

Heikin Ashi averages each candle with the one before it. This smooths out the noise, so trends and reversals stand out.

Hollow Candles add a second signal. A hollow candle closed above its open, and a filled candle closed below it. The color shows whether the close was up or down from the day before.

Measure Tool
The new Measure tool shows the distance between any two points on a chart: the price change in dollars and percent, plus the time and number of bars between them. Find it in the annotation tools menu in the chart toolbar.


Trades shows "--" when there's no count
When no trade count is available, the quote panel now shows -- for Trades instead of 0. This happens for all stocks on Schwab and for some futures.

Change Log
- NewCharts — Hold Ctrl and roll the mouse wheel to zoom the chart in and out
- NewCharts — Heikin Ashi chart style
- NewCharts — Hollow Candles chart style
- NewDrawing tools — Measure tool: shows the price change ($ and %), the time and the number of bars between two points
- ImprovedOption chain — Volume now shows for active strikes during market hours (for example SPY), alongside Open Interest
- ImprovedQuotes — Trades shows "--" instead of 0 when no trade count is available (for example Schwab stocks and some futures)
- ImprovedCharts — Live charts update more efficiently when a new candle starts
- FixedTradingBlock — Stop and Stop Limit orders now show their correct prices on the chart (both previously showed the Stop price)
- FixedCharts — The last candle on intraday timeframes no longer appears twice
Platform Features Release: Annotation Enhancements, Condor Trade Set Up
Announcing the latest Release of Annotation improvements and Strategy template adjustment. We’ve also made several practical changes for better access to features/functions.
Independent Default Settings for Annotations
When adding Annotations such as lines, rays, arrows, etc, to the chart, the settings for that type of annotation can be set as a “Default”. Line settings are independent of other annotations’ settings.
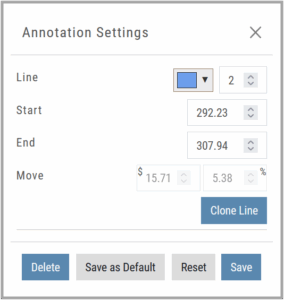
Add the Annotation.
Click on the annotation to display the Dialog box (shown).
Make any adjustments.
Click “Save as Default”
The newly added and future annotations of the same type will have the new settings.
Click “Reset” to revert to original settings.
Fibonacci Too!
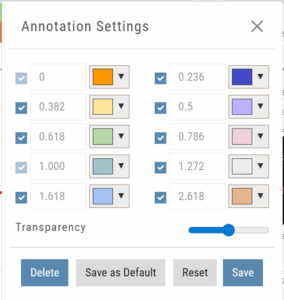 The Fibonacci Annotation has been enhanced to allow you to select which Retracement Levels you want to view in addition to adjusting the color for each as well as transparency overall.
The settings can be set as the Default for new chart entries.
**Please note: Existing Fibonacci annotations cannot be edited with this new coding. They must be deleted, then added back.
Condor Strategy Template Adjustment
The core functionality of Condor Strategy Templates has been adjusted. (Iron/Long/Short)
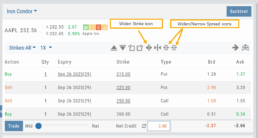
The center strikes are now anchored by default and will only change if you adjust them manually on the template itself or by using the “Widen Strike” icon —making trade construction more intuitive and consistent.
Widening/Narrowing of the center Strikes will change the spread of the Condor, which can be done manually on the template or by using the “Widen” or “Narrow Spread” icon.
Other Additions
- EOD lower Indicators will display “Chart Unavailable for intraday charts.”
- Zoom feature now includes a double-click “on-off” functionality
- HeatMap legend (Find>HeatMap) is movable
Change Log
- Heatmap legend is no longer fixed when clicked to view
- Transparency for shapes is resolved
- Price slice functionality adjusted for price changes
- Zoom feature is now toggle functionality
- Scrolling chart/arrow functionality resolved
Platform Features Release: Enhanced Annotation Capability and Indicator Settings
Announcing the latest features/functions updates, additions or edits to the trading platform:
Enhanced Annotation Capability
Additional features have been added to create Annotations, Trendlines and Notes on the Chart. Each can be customized by color, size and easily placed on individual charts.
Volume and Moving Average Indicator Updates:
Users have the ability to further differentiate Moving Averages on the charts by changing the type of Line.
Volume can now be selected as an Upper Indicator and/or Lower Indicator
Enhanced Annotations, Trendlines, Notes & Fibonacci capabilities
Additional & Enhanced Tools for Charting
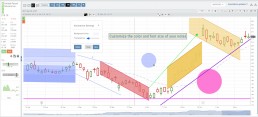
Enhanced Annotations, Trendlines, Notes & Fibonacci Retracements allow you to customize and edit for greater flexibility on your charting.
Rays, Horizontal Lines and Arrows have been added. All allow you to select the color and thickness of each for greater differentiation on the charts. Easily reposition with a simple click and drag to new location.
Notes can be text and color edited as well as repositioned.
Parallel Lines have been added and they, along with Fibonacci Retracements – allow you to customize the color and transparency on the charts.
Edits are easy: Click on the entry, edit as needed on the Annotation Box – which can be moved anywhere on the platform- as needed, to make any changes.
Volume and Moving Average Enhancements
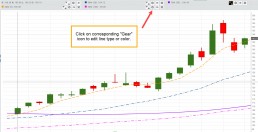
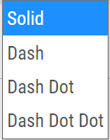
Customize your Moving Average indicator Lines – not only by color – but by the type of line:
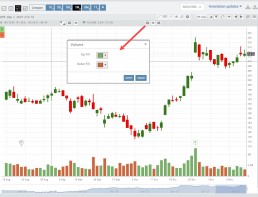
Volume, already available as a Lower Indicator, can be added as an Upper Indicator on the charts.
In addition, the Volume bar colors can be customized as they are an independent indicator from the candlesticks. This is done by clicking on the gear icon, as shown.
Change Log
- Added Stock/ETF symbol to Option Chain Window