Trading Sandbox Account - Overview
Unlike traditional broker-provided virtual accounts, the Sandbox is not bound by brokerage margin rules or limitations, giving you more freedom to practice and test strategies.
Trading Sandbox Account was built specifically to overcome these shortcomings, allowing traders to:
-
Test advanced strategies without brokerage-imposed limits.
-
Gain confidence in how options positions will behave through expiration and assignment.
-
Track true results on completed trades for more effective learning and analysis.
As with other simulated trading systems, the Sandbox uses delayed market data. However, it goes beyond conventional paper trading platforms in several key areas:
Fast & Reliable Order Execution
Orders are processed quickly during market hours, creating a more realistic trading experience compared to laggy paper trading systems.
Supports Conditional Orders for Stocks
Effortlessly include Stop and Limit Orders when buying stock.
Options Handling That Works
Options are properly assigned and exercised as they would be in a real account, removing the gaps found in most brokerage simulators.
Accurate Trade Capture
The Sandbox records and captures gains/losses on completed trades, giving you a clear picture of how your strategies perform over time.
Full Journal Support
When auto-journaled (default setting) is set, all activity is captured. Track your progress to see what strategies work, what needs more practice, for important feedback.
How To Add:
Sandbox has been added as a drop-down selection in the Portfolio section of your trading platform
-
Click the bottom left corner tab of the platform to display all account tabs
-
Click the “+” icon appearing below these tabs
-
Select “Sandbox” from the dropdown list. Check the “I agree…” box
-
Name your account and select a color identifier, if desired.
-
Start trading!
Platform Features Release: Compare and AI capability added, Tradier Streaming
Join us Wednesday, October 25th for a special Office Hours session for an in-depth review session of the newest enhancements to your platform.
Announcing the latest Release of feature and functionality enhancements to the trading platform with the goal of improving the investment/trading decision process.
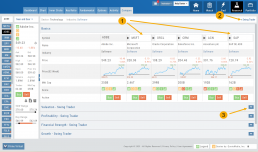
Research Tab/Dashboard:
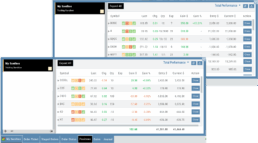
Compare Tab: Provides an at-a-glance comparison of competitors of the same industry group with the ability to change symbols and Swing, Position, or Investor views (also “All” and “Default”)
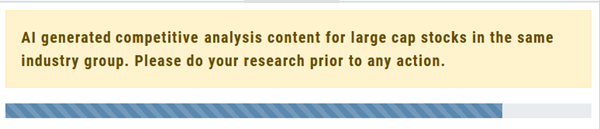
AI Analysis – AI generated competitive analysis for Large-cap stocks in the same industry group.
Compare Tab
The Compare feature, found under the Research Tab, allows investors to review a particular stock against its industry peers. Different Views offer Investors perspectives with different investment strategies, such as value or growth investing, to identify stocks that align with their preferred strategies within a specific industry.
Some of the Compare benefits include:
- Relative Valuation: Ratios like price-to-earnings (P/E), price-to-sales (P/S), or price-to-book (P/B) can be assessed whether a stock is overvalued or undervalued relative to its peers.
- Identifying Outliers: If a company has significantly different ratios compared to its peers, it may warrant further investigation to reveal potential investment opportunities or risks.
- Industry Trends: Analyzing ratios across an industry can reveal trends and patterns. For example, if the majority of companies in an industry experience a declining profit margin, it may indicate a broader industry challenge or trend.
- Risk Assessment: Comparing key ratios can help assess the financial health and risk profile in an industry context. Companies with lower debt-to-equity ratios, for instance, may be considered less risky, especially if this trend holds across the industry.
- Operational Efficiency: Comparing Ratios like return on equity (ROE) and return on assets (ROA) among industry peers can provide insights into a company’s operational efficiency.
NOTE:
While comparing key ratios within an industry offers valuable insights, it’s VITAL to consider other factors , such as the company’s business model, competitive advantages, management quality, macroeconomic conditions, etc. Ratios should be only part of a broader analysis to make well-informed investment decisions.
The fields automatically populate with industry peers. They can be changed to compare other symbols of your choice.
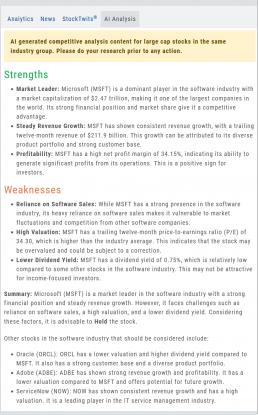
AI Analysis
Located within the Activity Tab in Research, Stock AI analysis has the potential to enhance and streamline the process of evaluating and trading stocks in the financial markets.
Stock AI analysis can quickly process and analyze vast amounts of financial data, news, and market sentiment in real-time. This enables investors and traders to make more informed decisions based on a comprehensive view of the market.
Click on the AI Analysis Tab for the current symbol you are viewing. A progress bar will appear while the information loads for the initial session view only. The information will remain even if you log out and back in again during the same Market Day.
It’s important to note:
While Stock AI analysis offers these benefits, it also comes with challenges and risks, such as overreliance on algorithms, potential biases in data, and the need for continuous monitoring and oversight. Investors and traders should use AI analysis as a tool to complement their decision-making process rather than relying solely on it.
Streaming Quotes with Tradier
Your Tradier Account offers Real-Time Streaming Quotes!
Simply log in to your Tradier account from the platform, and you’ll see the Real-Time quote updates without having to change screens or refresh your browser!

Change Log
- At-the-Money Strike price bolded on Templates
- Long Butterfly template error corrected
- Resolved slider bar/template editing functioning
- Event flag display function preserved
- Slider bar function corrected on template page
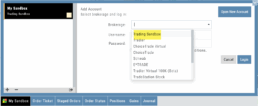
Adding an Account
Accessing a live account is easy. Currently Choice Trade, Tradier, Schwab, E*TRADE are offered through this platform. More brokerages will be added.
To add an Existing Brokerage Account or add a Virtual or Manual Account:
1. Clicking on the “+” icon will display the screen below
2. Select your Brokerage, Virtual or Manual Account from the drop-down
3. Read & Accept Terms and Conditions
4. Click “Continue”

Live Accounts will prompt you to enter your credentials on the next screen.
Virtual** and Manual Accounts will automatically activate.
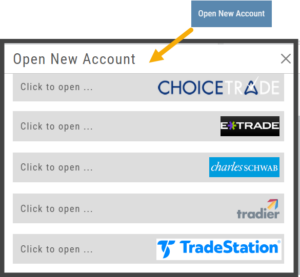 To add a New Live Account, click on the “Open New Account” box on upper right of the above screen.
Select the account you want to add by clicking the selected brokerage.
Click the “Done” button.
You’ll be directed to the brokerage website to guide you through the process of completing an application.
**TradeStation requires a completed account application to create a Virtual Account.
Manual Account Overview
A Manual Account is versatile resource tool which can enhance your trading effectiveness. You can also use this to track trades from an outside brokerage account.
Use the Manual Account for educational purposes.
- It offers flexibility and control, while providing the Analytics and Journal to help you reinforce the “Learning to Earning” process. This allows you to focus on learning the strategies.
- Place trades any time of day or night – all get immediately executed at the price entered. No need for the market to be open.
- No Buying Power limits – no expensive spread margin requirements to adhere to, no limit on how much you can buy/sell
- Place trades in the past.
- Enter trades from Backtest Mode
Use to tracking external accounts
- Can be used to track trades placed at brokers not integrated into the platform
- You can enter the date and fill prices of your actual trades
- This enables portfolio management along with your other accounts
- You can use full Journal function for tracking your progress
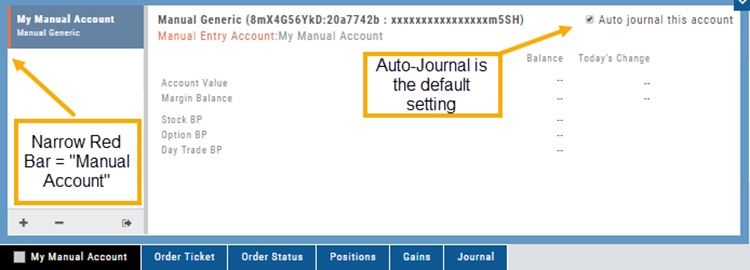
Manual Accounts are identified by a narrow Red Bar and are, by default, Auto-Journaled.
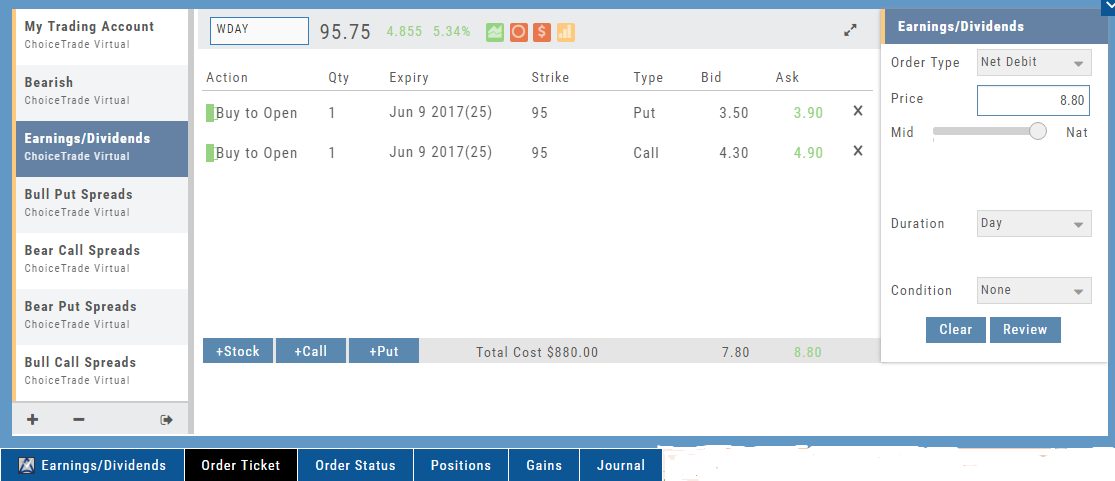
Entering trades in a Manual Account takes only a few steps and is similar to a regular trade.
You can also bring up the ticket from any trade point. Simply start a trade and select the manual account just like you would select any other account.
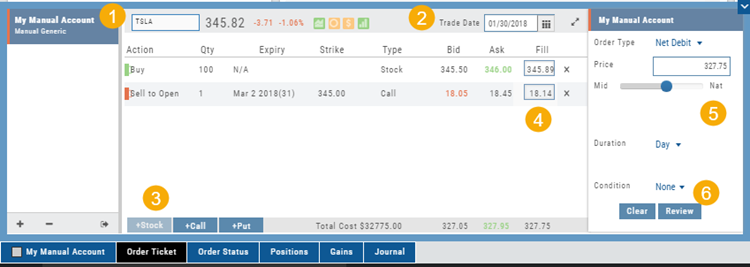
(Bold indicates unique to Manual ticket):
1. Enter the Stock Symbol, or name of Company (Smart search will display potential matches)
2. If this is a past trade, use the calendar/date picker to select date
3. Click “Stock”, “Call” or “Put” to build trade, change quantity, Expiry and Strike (if applicable)
4. Bid/Ask will automatically populate if a specific price is not entered
5. Complete Order Type, Duration and Condition
6. Click “Review” to confirm information is correct, then ‘Submit” on next screen.
The order will appear in Order Status as “Executed” and operate the same way as other accounts.
Virtual Account Overview
Virtual Trading gives you the real trading experience without risking any money. It is a valuable “next step” learning tool – designed to mimic the trading experience as closely as possible.
Trades are executed during Market hours – 9:30 a.m. – 4 p.m. Eastern Time, however there is a 15 minute delay after Market open for orders to begin executing.
As with Live Accounts, there are limits on trades if there is not sufficient Buying Power in your Virtual Account. There can be expensive Spread/Margin Requirements to adhere to.
Virtual Accounts do have limitations that Live Accounts do not have:
Virtual Accounts are not subject or responsive to Corporate actions such as buyouts, name or symbol changes, stock/option splits and strike price adjustments to name some examples.
![]()
Virtual Accounts are “Auto-Journaled”. This automatically keeps record of all trades for later analysis and reconciling.
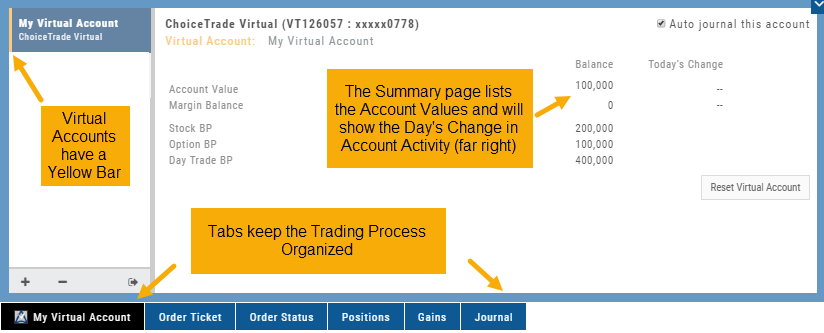
These practice accounts are identified by a yellow bar on the left side of the account window.
Virtual Accounts are powered by Choice Trade to provide the real trading experience.
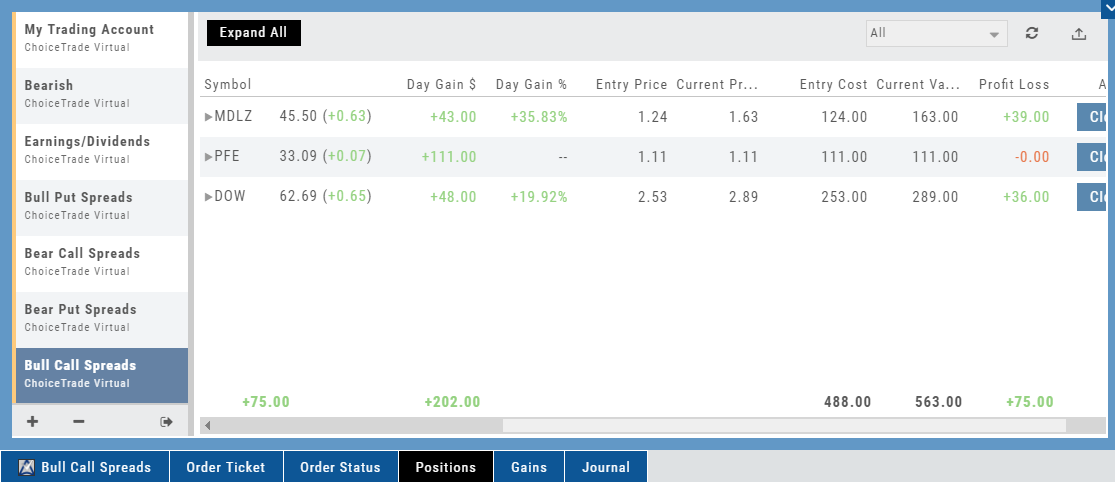
Access Trading Account Information
No need to login to Brokerage Account site for normal day-to-day activity.
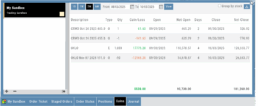
Each account includes a Summary page showing the Account Balance, Margin Balance, Stock, Option & Day Trading Buying Power and tracks the current trading day’s activity.
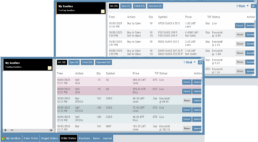
Besides the Order Ticket, the Order Status, Current Positions & Transaction History are all available. You can view previous order history in the Order Status tab by clicking on the drop-down menu on the upper-right corner of that screen.
You can access any account and switch accounts with a single click. You can even change the account from the order ticket.
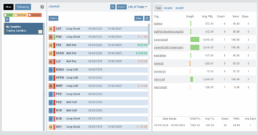
The newest feature, Journal provides the means of organizing, noting, analyzing & reconciling trades.

Delete Journal Entries
Whether you entered a trade incorrectly, or want to remove Cancelled Orders from your Virtual or Manual Account, you have the ability to delete a Journal Entry.
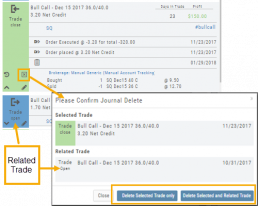
Simply expand the Trade tab and click on the ![]() icon.
icon.
If you are deleting Cancelled or Expired orders, you’ll be prompted to confirm you want to delete the entry.
For trades that have a specific Open and/or a specific Close, you’ll be prompted to choose either Selected Trade or Selected and Related Trade, if applicable.
Prior to deleting your selection, you’ll be prompted to confirm the action. Once deleted, the trade cannot be restored.
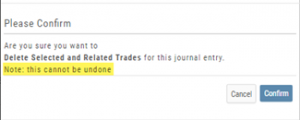
Note: Deleting a Journal entry for a Manual Account will remove the trade completely from both the Journal and Manual Account.
Deleting a Journal entry for Real or Virtual Accounts only remove the Journal entry, and the trade will remain in the account.