Price Slices - Premium Feature
Price Slices
Price Slices allow users to view theoretical outcomes of option positions, while providing the flexibility of changing data points, such as entry price or what the results will be if the stock price moves a specific dollar or percentage amount.
This feature is helpful with building discipline on when to exit a trade if it goes against you.
This feature is accessible when using the Strategy Templates on the Research>Option Tab
The default starting points include:
- Entry Point – shown in Blue in our example.
- High Point – considered Target or Resistance point – shown in Green.
- Low Point – considered Stop or Support point – shown in Red
(Up to 7 Price slices can be added for additional evaluation. See below for more details)
On Research>Option Tab, click the down arrow next to the default “Call+Put” view in the upper left corner of the window to access the Strategy Templates:
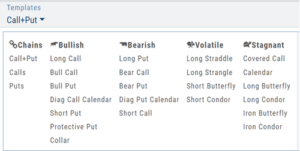
Select your Strategy and set up the position:
Quantity, Expiration Date, Strikes
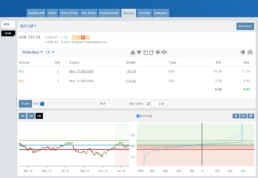
On the right side of the same screen, click the ![]() button to display the default settings.
button to display the default settings.
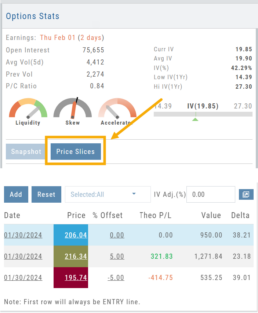
Using our example:
Entry point is $206.04 (Current Stock Price) shown in Blue
High point – defaults to 5% above Entry: $216.34, shown in Green/Gold
Low point – defaults to 5% below Entry: $195.74, shown in Red
The values are for ‘today’: what the Profit or Loss would be if the stock price were the High or Low price.
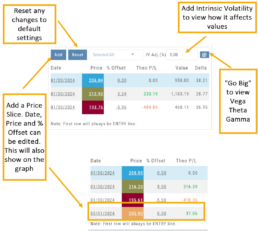
The Date, Price and/or % Offset can be manually adjusted, as indicated by the underline – to view different scenarios.
Price Slices – Adjust the % Offset Value
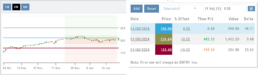
% Offset values were manually changed to 10% and -10%.
The lines on the graph are dynamically updated
Price Slices – Adjust the lines
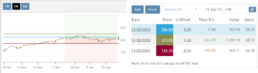
In this example, the Top and Bottom lines were adjusted on the graph itself.
The new placement dynamically updated the values on the right.
Price Slices – Add, Reset, Go Big
Multiple Position Analysis
We often have more than one position on a particular Stock/ETF, so how can each position, or leg be evaluated?

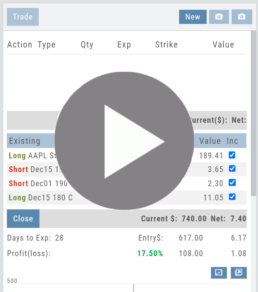
Click the Graphic Below for video on the Option Tab P/L Feature to see how to evaluate individual legs or positions on a Stock/ETF
Option Chain Video
Customize Watchlist Views
Customize Watchlist Views
You have the ability to customize Watchlist Views – based upon criteria you want to see.
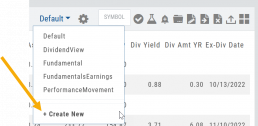
Click on the ![]() next to “Default” or current view you are on to create a different View.
next to “Default” or current view you are on to create a different View.
If/When you want to edit any of your personal views, simply click the ![]() icon, remove/add criteria, adjust placement, then click “Save”.
icon, remove/add criteria, adjust placement, then click “Save”.
From Assets to Z-Score, there are over 160 data points to select from including data from: Company Information, Technicals, Valuation, Fundamentals & Options.
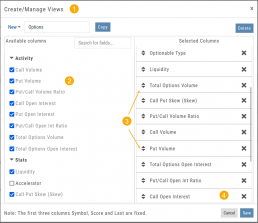
Simply:
1. Name the View
2. Select Data Points
3. Arrange – clicking on arrows to move up/down
4. Save
Your Watchlists are now more powerful because they show the data you want to see to help you make your trade decisions.
The Result:
Note: The Symbol, Score Icons and Last Price are fixed
Research Your Watchlists
Research Watchlist Functionality
Users are able to access all Watchlists from the Research Tab.
Click the ![]() to access the dropdown list as shown in the graphic.
to access the dropdown list as shown in the graphic.
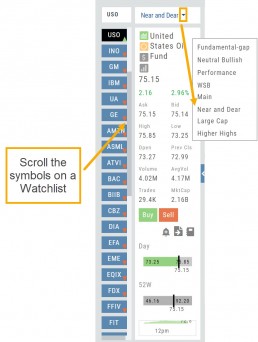
Lists with more than 20 symbols will have a scroll bar allowing for easier research of larger lists.
All other functionality remains the same: Symbols can be moved to other lists, have alerts set, deleted, add Journal notes
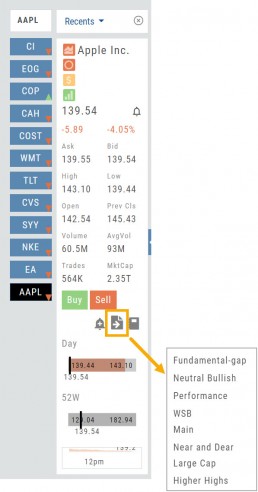
When a symbol is entered in the Symbol Search Box on the Research Tab, the symbol will automatically be displayed on the default “Recents” list.
In addition, when a symbol or group of symbols is sent to Research from anywhere else on the platform, it will appear on a list under the default “Recents” list.
Examples of when the “Recents” list will be displayed:
- Sending a symbol/symbols from a list on a Watch Tab.
- Selecting a group of symbols from a Scan or Screener list.
- Clicking on the Technical Icon from any symbol when not in the Research Tab. will be displayed under “Recents”.
The functionality of adding a note, an alert or sending a symbol to a specific list remains the same.
Option Chain Functionality
Option Chain Video
Research>Option Tab, click on “Expiration Cycle” for the “Call+Put”, “Calls” or “Puts” view.
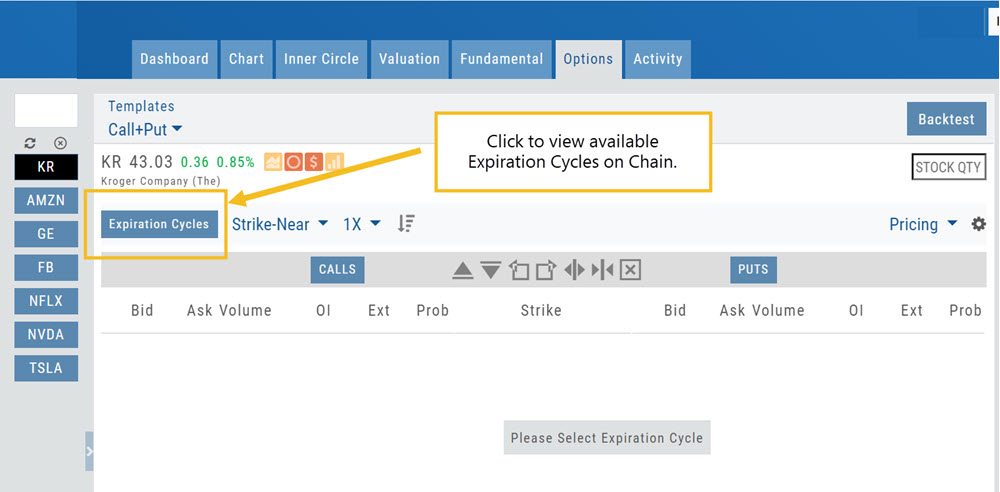
Option Chain Expiration Cycles
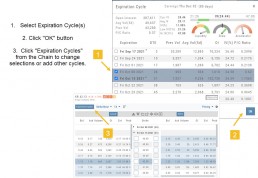
The Option Chain Expiration Table gives you control of selecting which Expiration Cycle(s) you want to view.
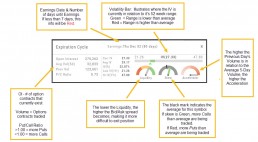
The Option Dashboard provides a wealth of pertinent information to make informed decisions easier.
See below for more detail
Expiration Cycles: All available options will be displayed. Monthly Options are indicated with an asterick![]()
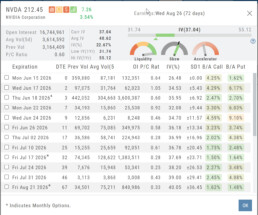
Select Expiration Cycles
Click ‘OK”
Chain will display for selected
The Dashboard Scan Tab
Get the current ‘story’ on a stock.
The Scan Tab is particularly interesting. In addition to providing a list of scans the stock is currently included in, it can give you a “story” about the stock. Based on the scans that the stock is showing up in, you can get an overview of outlook on the stock.
For example: JNJ shows solid longer term positive outlook.
XOM Shows stagnant with improving longer term outlook

Earnings, Dividends and more...
The far right, lower box in Research provides the following:
Earnings Tab: Get Earnings date, number of business days until announcement, Estimated and Actual Trailing Twelve Months (TTM) EPS, and link to the prior 12 Quarter Earnings details.
Dividend Tab: Get Yield, Amount, Payout Ratio (dividend/EPS), the Ex-Dividend Date (deadline to complete a stock purchase to be entitled to dividends), Payout information, Frequency and link to the prior 12 Quarter Dividends.
Scans Tab: Quickly view how many & which scans the stock symbol appears on.
Index Tab: Lists the symbol and indices name(s) on which this stock appears.
Split Date: Provides most recent Split Date, Detail and a link to view Split History

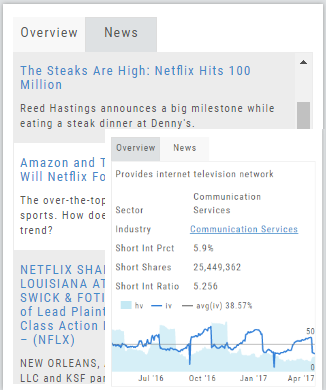
Overview & News
Located in ‘The Dashboard’, the Overview provides a snapshot of the company, including the Sector and Industry. By clicking on the Industry link, a list of stock symbols in the same category will appear. The “Stock Detail” list will have current market information and The Score navigational icons.
The News section lists articles covering, related to, or mentioning the selected Company. Click on any headline to be linked to the full article.