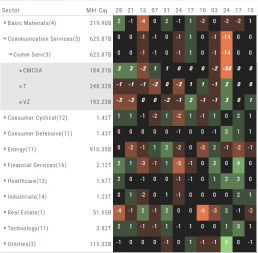
Spectrum Map View
In the Spectrum view, each column represents the slice of time selected: Day, Week, Month or Trailing Quarter. Once the Time frame is selected, it will be backtracked in each column (Example: April, March, February, January…)
Each row of the selected Index are initially broken down by Sector. By clicking the ‘action icon’, the Industry groups are shown. Clicking on the ‘action icon’ of each Industry will display the Stock symbols within that Industry.
The number and color of each box is a ‘slice’ that represents change (+/- , neutral) for that slice of time for that Sector, Industry or Stock using the Spectrum Color Legend as a reference.
Note the ‘action icon’ next to the Stock Symbol, enabling you to drill down, add to Watchlist, Research, Journal, etc.
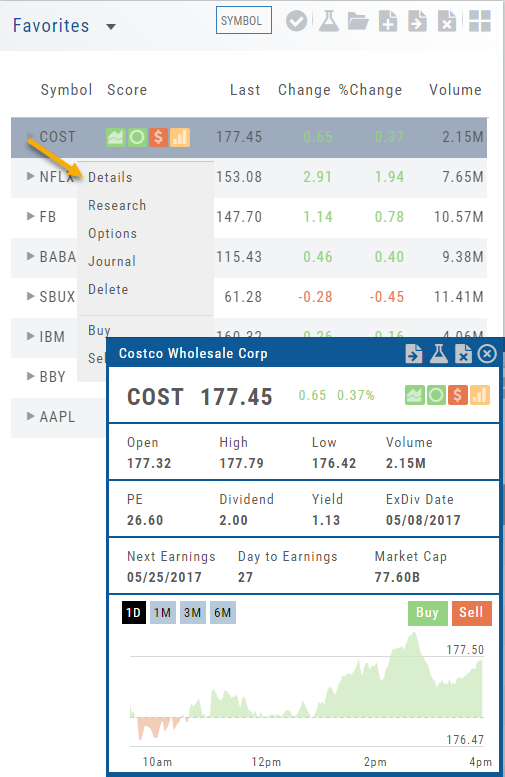
Quote Detail without leaving the List
A quick snapshot of a stock with navigational tools.
The Action Arrow Icon will provide a pop-up Quote Detail window including the current price, trading volume, Dividend Date -if applicable, Earnings Date and more. A chart, on the bottom part of the Detail Box, allows for difference periodices: 1 Day, 1,3 or 6 Months.
Notice the additional icons in the Quote Detail: You can send this stock to one of your Watch Lists, to Research or delete the stock if you wish. The Score Icons will direct you to the appropriate Research function. Buy/Sell buttons allow for quick order placing.