Research
Narrow the field to find the highest probability trades.
Stock
You’ve narrowed the field by selecting potential candidates matching the outlook and selected strategy, but which of those have the highest probability of success? Research allows you to drill down for information as much or as little as you want.
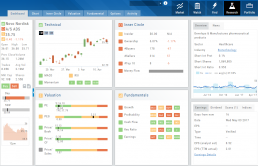
The Dashboard provides an overview: Quote Detail, The Score, Activity such as News/Earnings/Dividends and information about the Company and a list of other company stock symbols in the same industry. Each component has it’s own tab to provide more detail.

Components of The Score are designed to keep the information available to you, but out of the way when you don’t need it.
The Options Tab offers Strategy templates, option chains, snapshots and definitions of strategies, P/L Graph with Risk/Reward ratio, Analytics and Stock/Volatility charts.
The Activity Tab includes a Beta version of the Journal as well as News and StockTwits ®
The Power of "The Score"
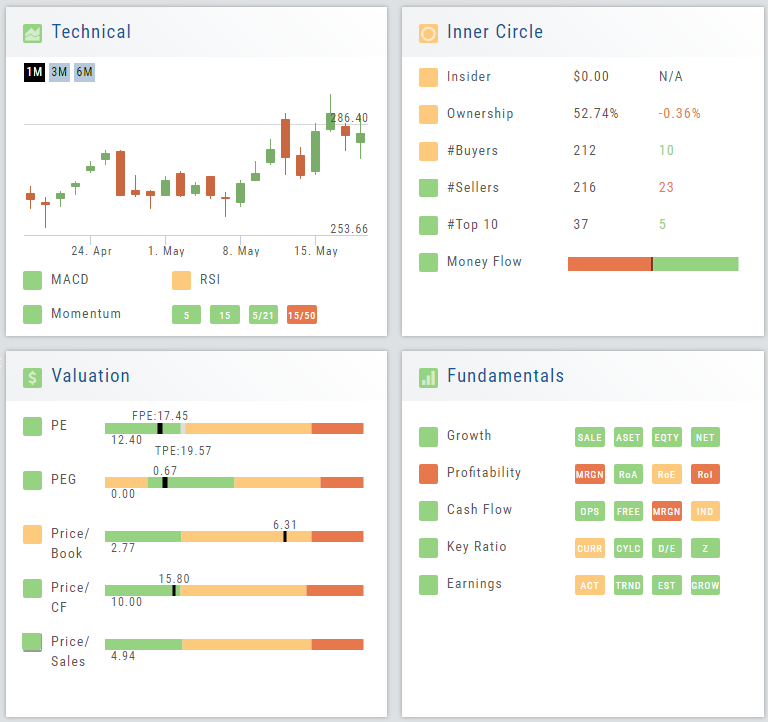
Our Proprietary Scoring System: Technical Analysis, Inner Circle, Valuation, and Fundamentals.
Designed with your workflow in mind and to give you the level of information you want, while keeping it out of the way when you don’t.
The order of The Score is based on the speed at which the stock is affected: Technicals being the fastest, and Fundamentals the slowest. For example, a very short term trader may not put as much weight on Fundamentals as with the Chart. However, as an actively managing investor, Fundamentals will be more influential on your trades.
Designed to provide the level of information you want
As much information you want. When you want it.
Each of our scoring algorithms are derived from several factors, all captured in a user-friendly format.
The stock dashboard provides a more detail summary layer view of The Score. Each component: Technical, Inner Circle, Valuation and Fundamentals allows you the ability to obtain the information you want, when you want it – and kept tucked away, when you don’t.
Overview of Scans
Want some ideas to take advantage of market conditions? This is the place to find Stock and Option opportunities based on bullish, bearish and stagnant outlook.
Choose from dozens of scans based on events or components of “The Score”: Fundamentals, Valuation, Technical & Inner Circle. 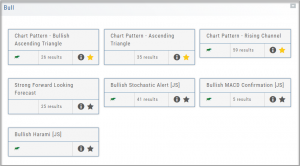
Ideas and Features offer even more opportunities.
The [i] icon provides a short explanation of the strategy.
Best of all, you are able to keep your favorites all in one place by ‘starring’ it for future use.
Score Navigation
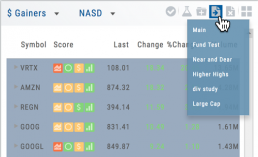
There’s more than one way to get the information you want.
Anywhere you see a Score Icon, you can navigate directly to the corresponding function of Technical Analysis, Inner Circle, Valuation, or Fundamental research – with a single click on the icon.
Technical Analysis
Technicals: The fastest indicators of The Score
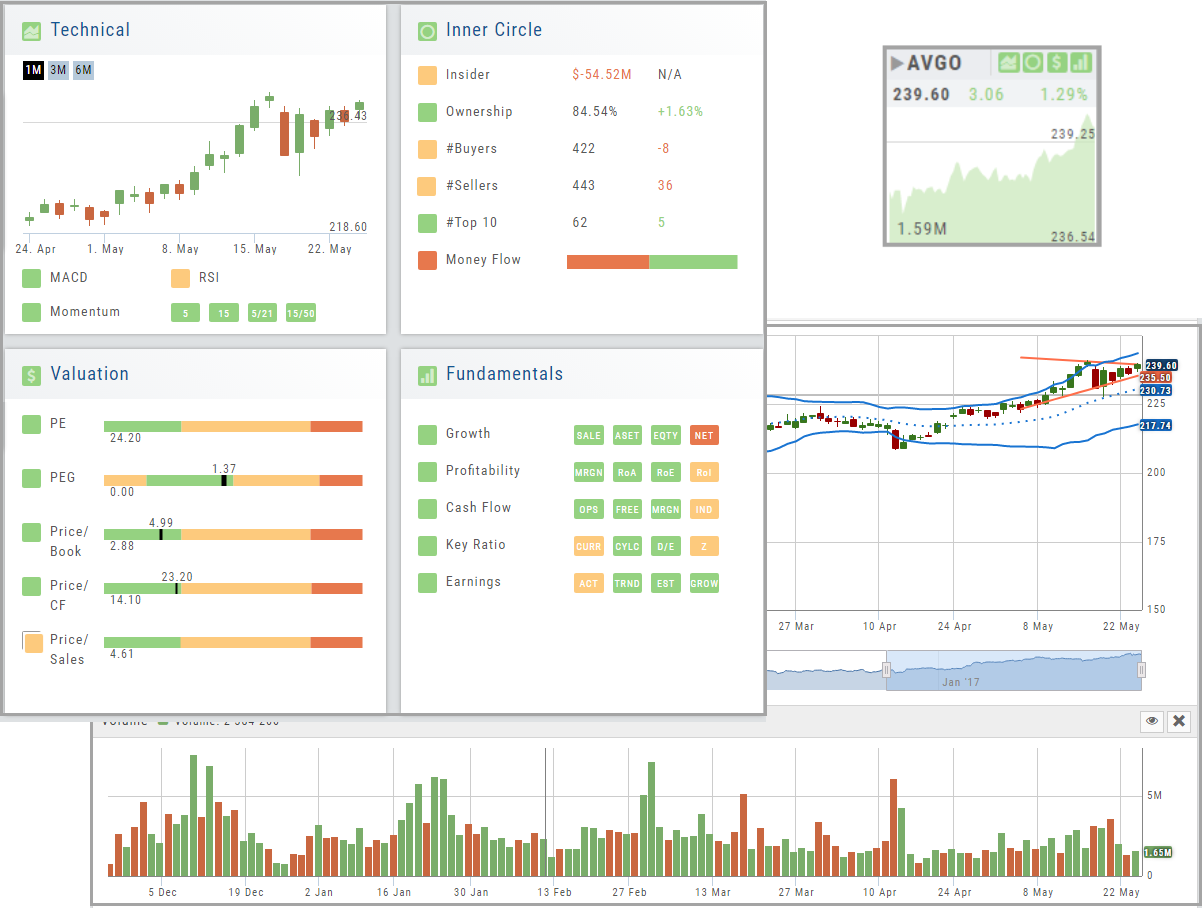
In Technical Score, 3 primary categories of studies are evaluated – MACD, RSI, and Momentum.
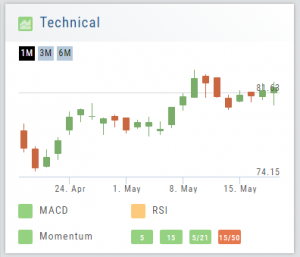
Momentum is made up of 4 different trend analysis timelines.
5 = Stock over the 5-day moving average
15 = Stock over the 15-day moving average
5/21 = 5-day moving average over the 21-day moving average
15/50 = 15-day moving average over the 50 day moving average
Note: Momentum indication is from fastest to slowest. This can be helpful in determining your time frame/outlook for the appropriate strategies.
By clicking on the Technical Score Icon anywhere in the platform, you’ll be taken to the Chart Tab under Research for that Company/Symbol.
Go to Charts for more in-depth information.
Valuation
Is it Overvalued or Undervalued?
Valuation looks at Key Ratios and Projected Price to evaluate the stock’s current value.
Key Ratios like both trailing and forward PE along with PEG (Price/Earnings/Growth) are weighed.
The Price compared to Book (flow of business), Cash Flow, and Sales are also very important factors to provide a well-rounded synopsis of the valuation modeling of the stock.
Fundamentals
A complete perspective of performance in one place.
Fundamentals looks at 20 critical financial analysis ratios in 5 different categories: Growth, Profit, Cash Flow, Key Ratios, and of course, Earnings. 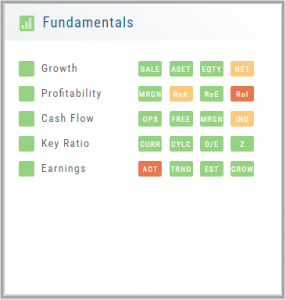
We also take into account Quarter over Quarter, Year over Year, and Trailing Twelve Months’ (TTM) performance with our proprietary weighting formula. View historical data by clicking on the upper right corner buttons in each window.
Fundamentals is the slowest of The Score components to affect stocks, due to the limited times throughout the year data is released. Active investors would generally place more weight on Fundamentals than would a very short-term trader.