Platform Features Release: Set Alert from Option Tab
This Release focused on fixes and set-ups for future capabilities and added the following:
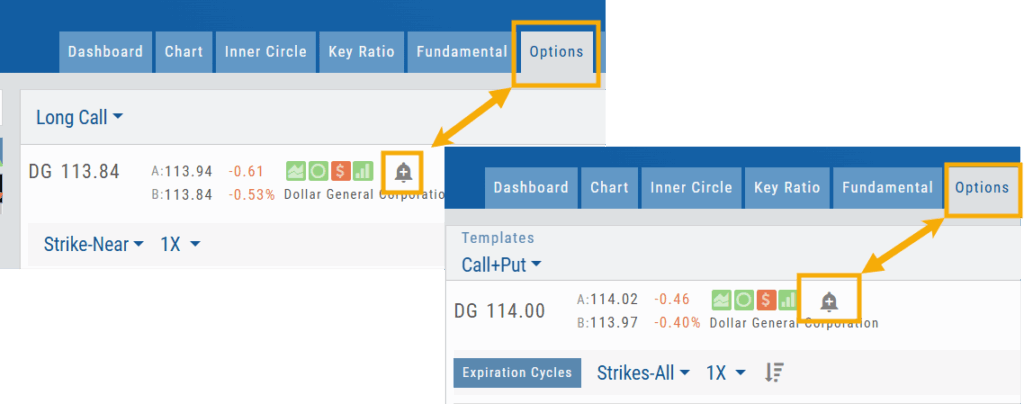
Setting Alerts Enabled from the Option Tab in Research.
Bracket Order capability in ChoiceTrade Virtual Accounts
Set Alerts from Option Tab
Alerts can be set from the Option Tab – as, in Research, this was the only tab where the Info box on the left side of the screen was not visible.
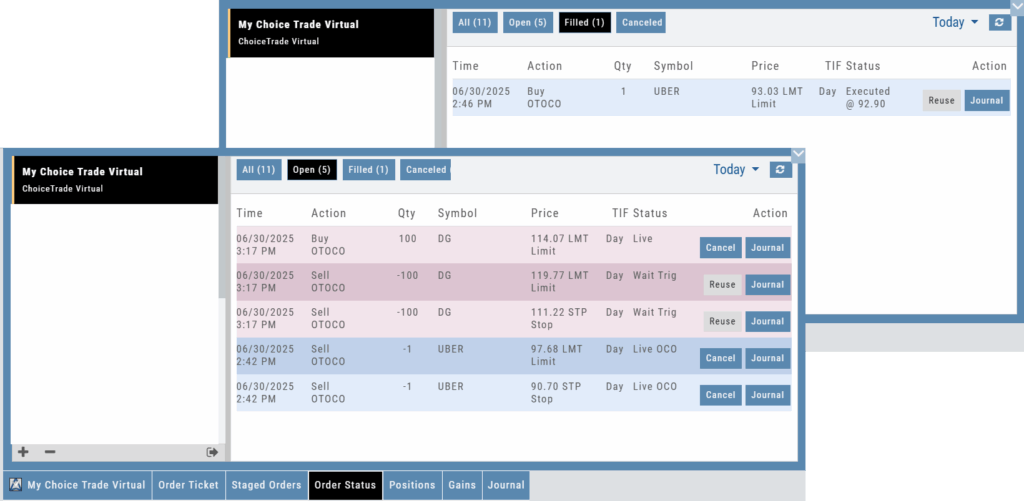
ChoiceTrade has Bracket Order capability
ChoiceTrade supports Bracket Orders on Stock.
Change Log
- Resolved “Reset Zoom” function on chart vertical expansion
- Alert Expiration is midnight of Expiration day
- Mobile App Account highlight function corrected
- Chart Period selection – activation area increased
Multiple Position Analysis
We often have more than one position on a particular Stock/ETF, so how can each position, or leg be evaluated?

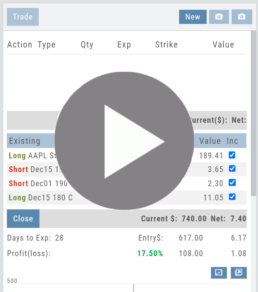
Click the Graphic Below for video on the Option Tab P/L Feature to see how to evaluate individual legs or positions on a Stock/ETF
Option Chain Video
Platform Features Release: August 2022
Announcing the latest Release of feature and functionality enhancements to the trading platform. These allow for more customizing ability and streamlines functions on accessing or displaying information. Highlights include:
Screen for Weekly Options – The ability to screen for weekly options has been added to the Screen Function under Find.
Rearrange Screener Data Points – Change selection order directly on the Results page, by drag/drop action.
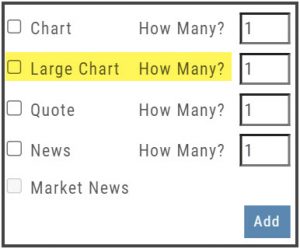
Large Chart Widget on Custom Page –The new widget fits an entire row on the custom page.
Customize Moving Averages – The Moving Average thickness can now be customized.
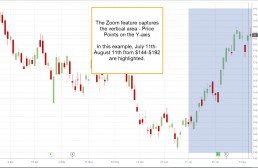
Vertical Zoom on Chart – Function expanding to allow for Horizontal and Vertical Zoom.
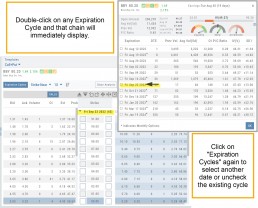
Double-click function on Expiration Cycle Page –Eliminates need to click “Okay” button
Screen for Weekly Options
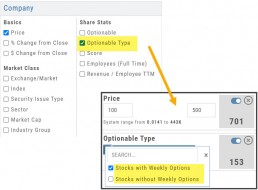
The Screener – located under the Find Tab – now provides the ability to screen for Weekly Options.
Now customizing your own searches is even better!
Remember, you can save Screens for future use – and even edit/update them as needed.
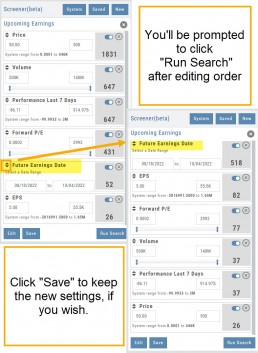
Rearrange Screener Criteria
Rearrange Screener data points on the Results page by clicking ![]() located on the upper left corner of each data point, then drag up/down.
located on the upper left corner of each data point, then drag up/down.
The data points are filtered with each entry in the order they are listed.
Additional edits can be made with the existing Screener data points:
Click ![]() to keep the data point but disregard in an updated “Run Search”.
to keep the data point but disregard in an updated “Run Search”.
Click ![]() to remove the data point from an updated “Run Search”.
to remove the data point from an updated “Run Search”.
Save to keep the edited Screener for future use.
Large Chart Widget on My Custom Page
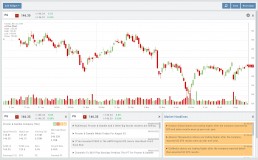
An individual chart can be set on an entire row on the Custom Page by selecting the Large Chart widget.
The Custom Page set-up and arrangement remain the same.
Customize Moving Average Lines
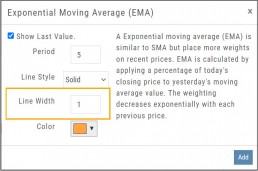
All Moving Average Indicators, Exponential, Simple, Triangular and Weighted can be customized to set Line Width. The default setting is ‘1’.
This update, along with previously added, user-defined “Line Type” allows for even more identification in charting analysis.
Expiration Cycle Double-click Functionality
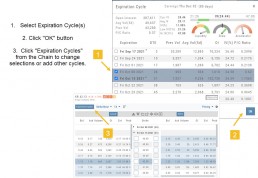
Quickly access one or more Expiration Cycles by double-clicking on each row you wish to evaluate.
The selected dates will automatically display on the Chain.
Click “Expiration Cycles” button again to revise/add to existing cycles.
Vertical & Horizontal Zoom Functionality
Change Log
- Corrected “Extend By” behavior on Chart with Streaming
- Created ability to reconcile partial trades
- Updated Annotation editing capability when adding text
- Resolved Edge browser/Annotations conflict
- Volatility Stop Indicator – expanded
- Fixed navigation break: Chain>Chart>Chain
- Analyze function restored on certain strategies
- Alert tool-tip correction
- Adjusting Parallel lines now saving
- Corrected Pending/Executed Order on Chart display
Platform Features Release: April 2022
Announcing the updates, additions and edits to the trading platform:
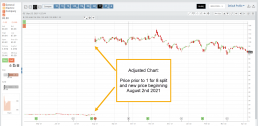
Capability to adjust charts for splits
When a stock had a previous stock split, a button appears above to view Adjusted/Unadjusted Chart.
Data Points added to Option Chain
Get % return on Expiration and annualized % values for covered positions.
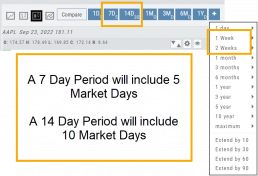
Intraday Chart Period Update
1 Week displays as 7 Days. 2 Weeks displays as 14 days.
Chart Adjusts for Splits
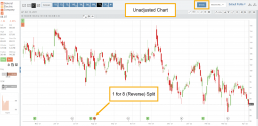
When a stock has a Split history, ![]() will appear next to the Indicator Box above the chart.
will appear next to the Indicator Box above the chart.
Make sure the chart period selected covers when the split occurred. This is identified on the x-axis of the chart as ![]() .
.
When the “UnAdj” button is clicked, the chart will display ‘before’ & ‘after’ split pricing.
Click the “UnAdj” button again to restore the prior chart display.
New Option Data Points Added
New data points have been added to assist in analyzing returns.
Covered Return – return based on expiration for $ used to buy shares for covered positions.
TVI% – Covered Return annualized
These are available on the Calls/Puts Chain and are also available as data points for Option Chain Custom Views
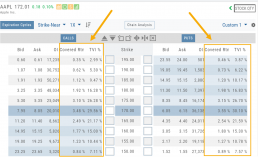
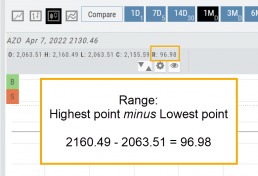
Chart Enhancements: Chart Periods & Candlestick Range
Change Log
- Resolved Saved Screener settings glitch
- Corrected Backtest Analyze date ability
- Restored sort capability in Institutional Activity
- Corrected profit/loss % display in Virtual Accounts
- Restored missing PEG/TTM data
- Enhanced contrast/dark theme notation
- Corrected Virtual Account Gain/Loss display
- Lower Indicator placement ability restored
- Earnings Data restored, added Time of Day
- Duplicate TDA Journal tab resolved
Platform Features Release: New Option Chain Functionality/Appearance, Responsive P/L Graph
Features Release Notes:
New Option Chain Functionality/Appearance, Responsive P/L Graph
Announcing the latest features/functions updates, additions or edits to the trading platform:
Option Chain Functionality/Display has been revamped to allow users to control which information to view and increase responsiveness. Symbols, such as SPY and SPX, will load noticeably faster. An incorporated Dashboard provides a snapshot of current activity allowing users to make more informed decisions.
Responsive P/L Graph adjusts when the slide bar between Bid and Mid price is adjusted. This is especially helpful when the spread is considerable.
Option Chain Display/Functionality
Select Expiration Cycles
The redesigned Option Chain allows users control of what Expirations to view instead of the platform defaulting to a cycle approximately 30 days out.
Click on the Options Tab from Research.
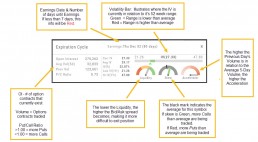
A window with available Expirations will appear along with a Dashboard with pertinent information (Volume, IV, OI, Earnings Date, etc) for more informed decision-making.
As a bonus, this structure allows data to load faster – especially helpful for those symbols with large option chains.
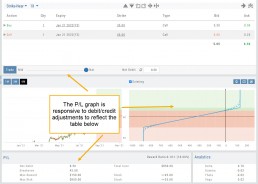
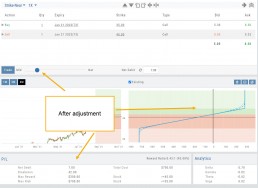
Responsive P/L Graph
The P/L graph on the Options Tab is responsive to adjustments made to the trade set up for the entry Net Debit/Net Credit.
Note, the smaller the spread between the Bid/Ask, the smaller the graph adjustment will be.
The example illustrates a large spread to better illustrate this feature update.
Change Log
- Price representation on chart X/Y axis corrected
- Journal Notes enhancement
- Saved screeners adjustment
- Active Watchlist access corrected
- Close from Backtest saves Symbol
- Clarified wording on Warning Message
- Mobile version of Saved and System Screener
- Mobile app – rolling trade adjustments
- P/L ‘Go Big’ data correction
- Account Summary page enhancement
- Large number displays on HeatMap
Option Chain Functionality
Option Chain Video
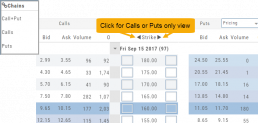
Research>Option Tab, click on “Expiration Cycle” for the “Call+Put”, “Calls” or “Puts” view.
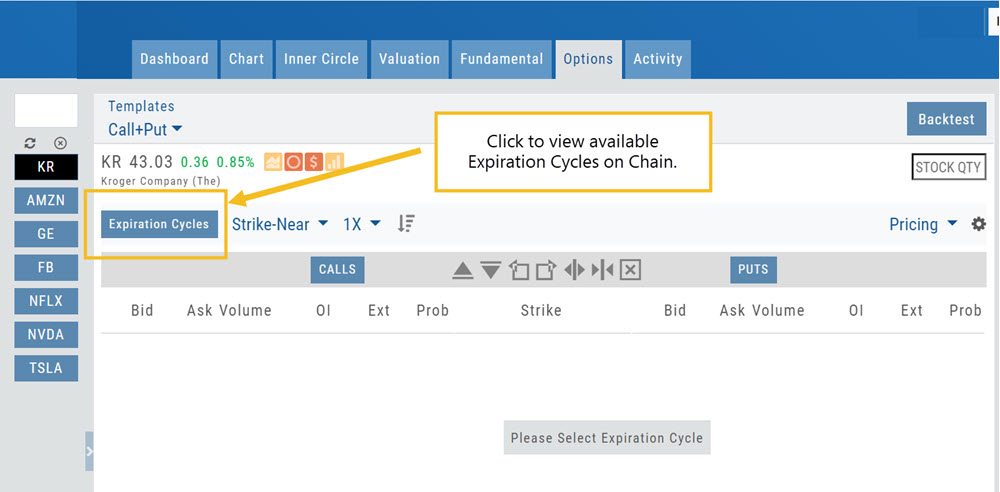
Option Chain Expiration Cycles
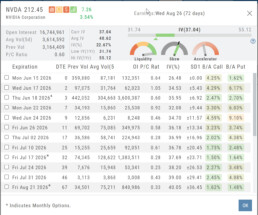
The Option Chain Expiration Table gives you control of selecting which Expiration Cycle(s) you want to view.
The Option Dashboard provides a wealth of pertinent information to make informed decisions easier.
See below for more detail
Expiration Cycles: All available options will be displayed. Monthly Options are indicated with an asterick![]()
Select Expiration Cycles
Click ‘OK”
Chain will display for selected
Options Navigation
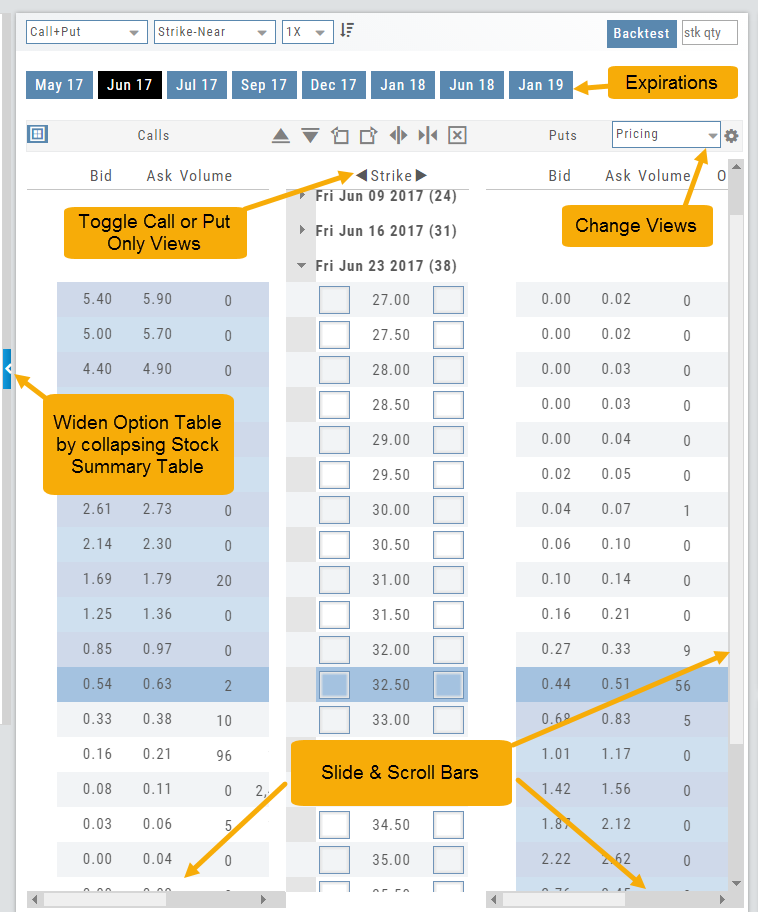
Expirations are displayed above the Option Table.
Select the months to view by clicking on the appropriate box. All available dates are displayed. Remember, the further out the option expiration is, the fewer dates are available.
Toggle between Calls Only or Puts Only view.
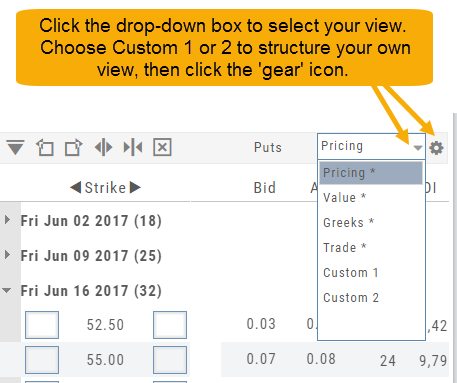
Change Option Table views to Pricing, Value, Greeks, Trade or new Custom views you create to suit your needs.
The small tab on the left side of the table will collapse the stock summary box & widen the option table.
The scroll bar on the right side and slide bars at the bottom on the table offer additional navigation.
Chain Views
Different views are available for options such as Calls + Puts, Calls only or Puts only. Select from the drop-down box or toggle the screen using the arrows ![]() in the chain header.
in the chain header.
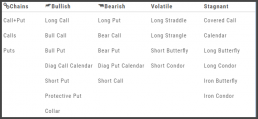
In addition, there are over 20 strategy templates on the Options tab.
Option Tables & Templates
Expanding your Options!
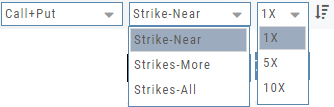
Choose from Call+Put chains, Call Matrix, Put Matrix or from almost 2 dozen Option Templates – covering any market outlook.
Expand the Strikes displayed: Near ATM, More or All.
You can change the click Quantity default increment by changing the default parameter for 1x, 5x or 10x.
You can also sort the Strike prices: Lowest to Highest, or vice-versa.
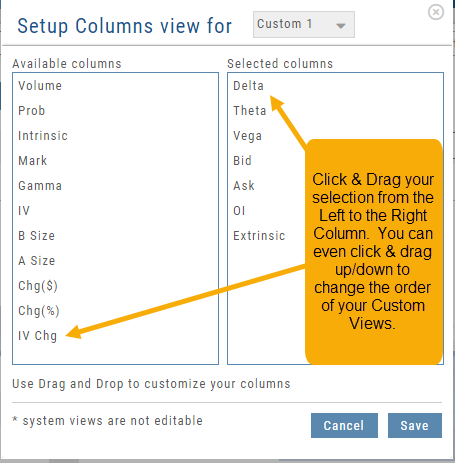
Create Customized Option Table Views
Create, edit and re-create custom Option Views.
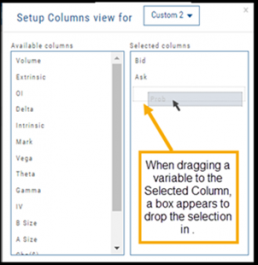
This feature allows you to create up to two customized Option Tables. Add/remove categories or even change the order of category columns by clicking on the criteria, then drag/drop it to the new location.
Click ‘save’ and you’re done.
Note: You can change the order of your variables you select by clicking/dragging the variable up or down. The custom views can be changed at any time – to adjust to the user’s needs.