Announcing the updates, additions and edits to the trading platform:
Capability to adjust charts for splits
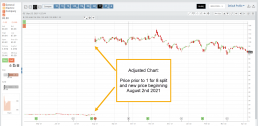
When a stock had a previous stock split, a button appears above to view Adjusted/Unadjusted Chart.
Data Points added to Option Chain
Get % return on Expiration and annualized % values for covered positions.
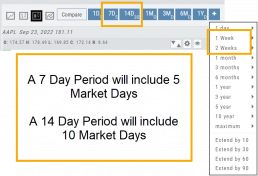
Intraday Chart Period Update
1 Week displays as 7 Days. 2 Weeks displays as 14 days.
Chart Adjusts for Splits
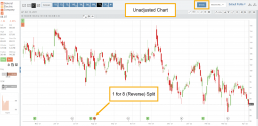
When a stock has a Split history, ![]() will appear next to the Indicator Box above the chart.
will appear next to the Indicator Box above the chart.
Make sure the chart period selected covers when the split occurred. This is identified on the x-axis of the chart as ![]() .
.
When the “UnAdj” button is clicked, the chart will display ‘before’ & ‘after’ split pricing.
Click the “UnAdj” button again to restore the prior chart display.
New Option Data Points Added
New data points have been added to assist in analyzing returns.
Covered Return – return based on expiration for $ used to buy shares for covered positions.
TVI% – Covered Return annualized
These are available on the Calls/Puts Chain and are also available as data points for Option Chain Custom Views
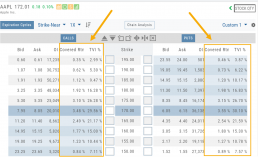
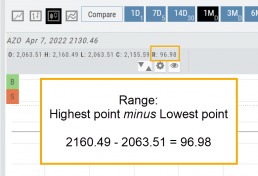
Chart Enhancements: Chart Periods & Candlestick Range
Change Log
- Resolved Saved Screener settings glitch
- Corrected Backtest Analyze date ability
- Restored sort capability in Institutional Activity
- Corrected profit/loss % display in Virtual Accounts
- Restored missing PEG/TTM data
- Enhanced contrast/dark theme notation
- Corrected Virtual Account Gain/Loss display
- Lower Indicator placement ability restored
- Earnings Data restored, added Time of Day
- Duplicate TDA Journal tab resolved