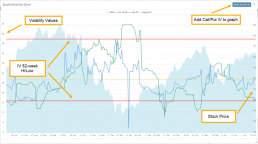
Historic & Implied Volatility
This chart displays Historic (HV) and Implied (IV) Volatility with the ability to overlay Call/Put IV
Historic Volatility (green line) is based on how the stock actually moved.
Implied Volatility (blue line) is based on how the options are priced.
When expanded, the stock chart, 12-Month Mean (Average) IV and one-year IV High/Low (red line) are also shown. This is very helpful in understanding if option premiums are comparable to historic values.
High HV indicates recent strong movement.
High IV indicates higher premium and, in many cases, anticipated movement.
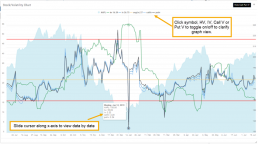
Note: You can remove the Stock Chart, HV, IV or Call/Put IV simply by clicking on the corresponding indicator above the chart/graph.
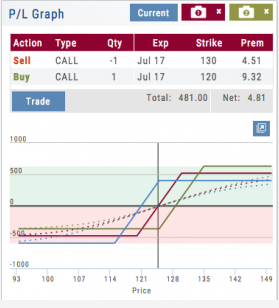
Trading from Options Page & Strategy Templates
Structure and analyze any options position. When ready, click “Trade” to create and submit an Order Ticket.
Comparing trades with Snap? ![]()
Simply choose the structure you want then select “Trade” to send it to the Order Ticket.
Trading multi-leg positions is easier than ever!
Other Navigation
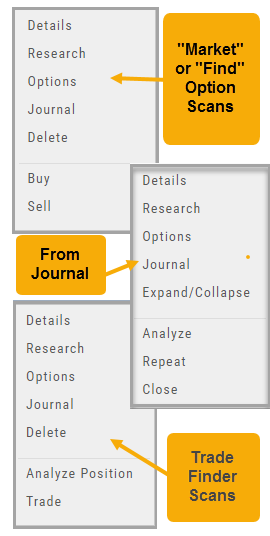
Icons = Navigation
The Action (Arrow) icon will provide different actions depending on where you are in the platform. For example if you are in the Market or Find tab, ‘Detail‘ will provide a Quote Popup. ‘Research‘ will take you to the Dashboard – overview – of the stock. ‘Options‘ will take you to that part of the platform etc.
When in a “Trade Finder Scan” (identified by the ![]() icon), the Action icon choices includes: ‘Analyze Position’ which will take you to the Options tables and/or ‘Trade’ which will lead you to the Order Ticket of the Brokerage Account from the menu.
icon), the Action icon choices includes: ‘Analyze Position’ which will take you to the Options tables and/or ‘Trade’ which will lead you to the Order Ticket of the Brokerage Account from the menu.
The Action Icon is also found in the Journal. Under the “Positions” tab, clicking on the icon allows you to Expand/Collapse details of the trade, Analyze or Close the trade among other choices.