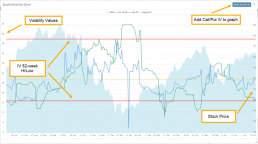
This chart displays Historic (HV) and Implied (IV) Volatility with the ability to overlay Call/Put IV
Historic Volatility (green line) is based on how the stock actually moved.
Implied Volatility (blue line) is based on how the options are priced.
When expanded, the stock chart, 12-Month Mean (Average) IV and one-year IV High/Low (red line) are also shown. This is very helpful in understanding if option premiums are comparable to historic values.
High HV indicates recent strong movement.
High IV indicates higher premium and, in many cases, anticipated movement.
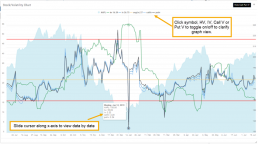
Note: You can remove the Stock Chart, HV, IV or Call/Put IV simply by clicking on the corresponding indicator above the chart/graph.