Link Trades in Journal
Trades can easily be linked in the Journal. This is helpful to keep related trades grouped together for easier tracking and analysis.
Some common applications include:
- Covered Calls – keeping stock and selling Calls with different Expirations
- Adjustment/Repair Trades
- Other previously Unmatched trades
This feature is best used in the Life of Trade View in the Journal.
The following steps will allow you to Link Trades: 
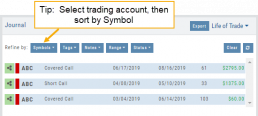
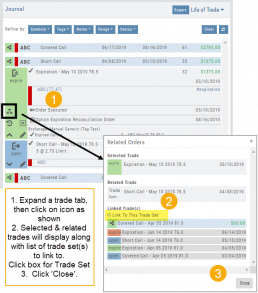
1. After selecting your account and sorting by symbol, expand one of the trade tabs you want to link to another trade group or set.
Click the ‘Link Icon‘
2. A pop-up window will list the Selected (Expanded) Trade, any related trade and Available Trade Sets for that symbol in that account.
Note: You can link trade sets both prior to and following your current, selected trade.
Example: You want to link a May 2019 expired Call to April 2019 and June 2019 Covered Call trade set.
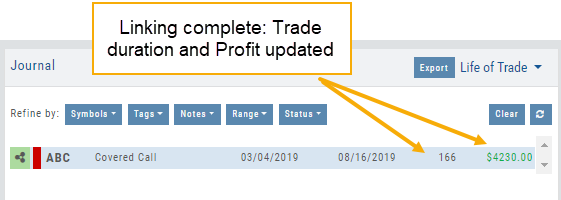
3. Click “Link To This Trade Set” for trade set(s) to link selected trade to, then click “Close“.
In this example, we linked an Expired May 10 2019 short call to an April and June Covered Call trade set.
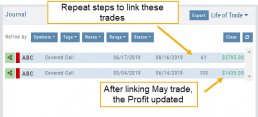
After linking the trade, notice the total Profit (Loss) Amount updated, but the trade duration did not.
This is because the May Call falls in between the original April trade entry and the June expiration.
If you have more trade sets to link, repeat the previous steps as outlined.
Final note: If you link a trade in error, simply expand the same trade tab and ‘uncheck’ the Link This Trade Set box.
Life Of Trade Icon/Color Codes
The Life of Trade Icon and Tab/Trade entry color show help you identify the status of your trades.
Icon Display and Color Coding
Note: Orders are automatically updated when you login to your trading account, whether Live, Virtual or Manual
 Blue – Hollow Dots – No Connection
Active Order or Open Original Trade
 Yellow – Hollow Dots – Open Connection
The Original Trade has been adjusted, but is still an Active Trade
 Yellow – Solid Dots – Closed Connection
The Trade and any Adjustments have been closed, but one or more entries need to be
Matched or Reconciled
![]()
Green – Solid Dots – Closed Connection
Closed trade – which includes any adjustments – resulting in a Profit
![]()
Red – Solid Dots – Closed Connection
Closed Trade – which includes any adjustments – resulting in a Loss
Trade Entry Lines
Note: Depending on the Theme used, the following colors will vary. The bar color denotes whether the trade needs action – such as Reconciliation or Matching to another trade.
Blue Line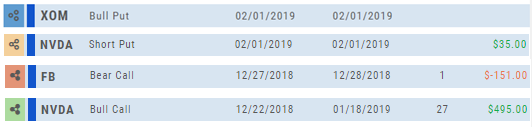
No action needed on these entries. The colored left tab shows the status of each trade:
Blue: (Open Trade, hollow dots, no connection), Yellow: (Adjusted, hollow dots, partial connection), Red: Loss (Closed, solid dots, connected), Green: Profit (Closed, solid dots, connected)
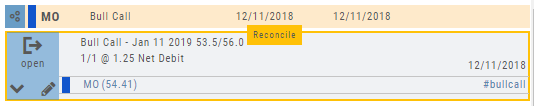
Yellow Line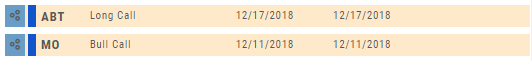
Action is needed on these trade entries. The Trade may have gone through Expiration and needs to be Reconciled. By clicking on the Trade Line, the Trade Tab will display:
Once the action is completed, the entry will update on all Journal tables including the Tags, P/L Graph & Insight tabs.
It is important to reconcile expired trades to properly display profit and provide updated analytical information on your trading success.
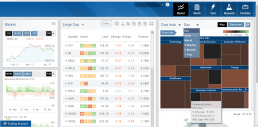
Market - The Big Picture
Start here for the overall outlook.
Designed to show what the overall markets are doing by viewing the graphs, charts and maps. You can change the time frame to check trends, use the maps on the right side of the page for a picture of sectors in relation to the market. Even drill down to industry within the sector and more.

Color Codes of The Trade Journal
The Tabs on the Journal are Color Coded for Easy Understanding of the Trade
Primary Tab Color Coding (see below for expiration tab coding)
Note: Orders are automatically updated when you check order status. Just make sure to select the time frame to cover the trades that need updating
 Light Blue
Active Live Order
This indicates that you have a current live order
 Dark Blue
Trade – Open
This indicates the opening transaction of a trade
 Gray
Gray
Expired or Canceled Order
This can be from a order that you canceled, or a day order that did not get filled
 Green
Green
Closed Trade – Profit
This indicates a trade that you closed for a profit
 Red
Red
Closed Trade – Loss
This indicated a trade that you closed for a loss
 Yellow
Closed Trade – Unmatched – Requires action to match to related
trade. Expand tab to see detail of trade.
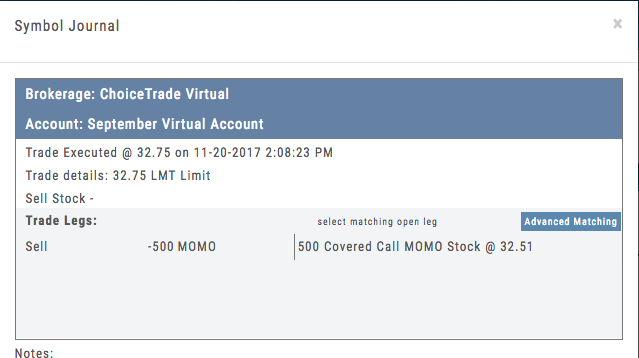 Unmatched Trades can happen if there are multiple trades and an entry trade needs to be identified or because a multi-leg trade was split on exit, or change of stock position when an option expired (exercise/assignment)
This is easily matched by clicking the edit icon (pencil) and selected which open order to match to. In some cases there may only be one, and it is simply a verification.
Expiration Tab/Tagging Colors
 Red or Green with No Color Tagging
This indicated the option trade expired Out of the Money (OTM)
There were no options exercised or assigned through expiration
 Red or Green with Dark Green Color Tag
This indicated that there were ITM options exercised/assigned
However, there was no change is stock ownership. Example: Bull Call where both legs were exercised/assigned.
 Red or Green with Yellow Color Tag
This indicates a change in stock ownership through exercise/assignment
This will happen with single leg options trade or where one leg of a spread was ITM at expiration
It is important to reconcile expired traded to properly display profit. If there are unreconciled expired options, the reconciliation window will automatically display when you go to the options tab.
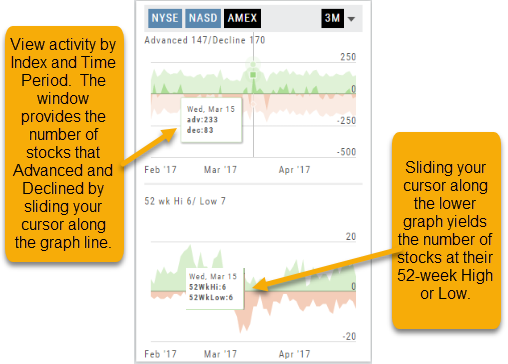
Market Overview: Get more of a broad view
View activity of the NYSE, Nasdaq or American Stock Exchange by time frame. The upper area of this part of the Market Tab shows the number of advancing or declining stocks by sliding your cursor along the graph.
Likewise, the bottom portion of shows the number of stocks that reached their 52-week High or Low by sliding your cursor along the lower graph.
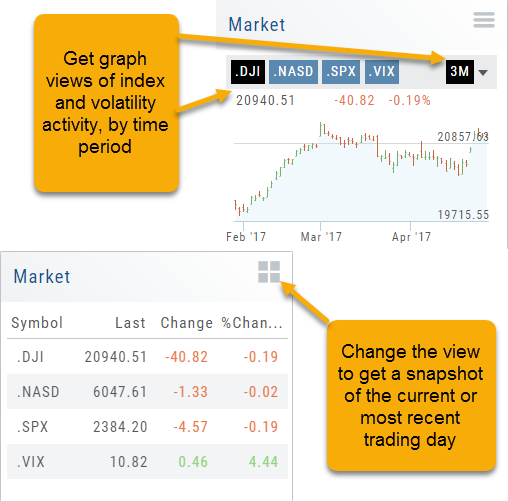
The constant figures show the number of stocks in each category for the current/most recent trading day.
Portfolio
Manage Your Portfolio from the Platform
With Brokerage Integration you can trade directly from the platform with select brokerage firms. Currently TD Ameritrade and Choice Trade are available. With more on the way.

Market - Index Overview
In the default Graph View, get an visual view of Market or Volatility Index activity by a 1-day or 1, 3 or 6 month time frame. By sliding your cursor along the graph, an activity box will display more in-depth activity: Every two minutes for the 1-Day Graph, or Daily for the 1, 3 or 6 month graph.
The current market activity/most recent trading day, regardless of time-frame, is present on the default view under the Index box selections – or by selecting the List View to get: Current, point change and percentage change (green = positive, red= negative).
Strategy Template
A Strategy Template provides a shortcut to quickly create an option strategy, virtually eliminating structure errors. Once selected, you can modify the structure within the template using the tools on above the option tables: Moving Strikes up/down, rolling Time out/in, widening or narrowing Strikes.
![]()
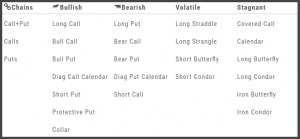
Some strategies can be changed from all Calls to all Puts (and vice-versa).
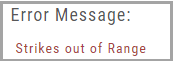
Note: The templates will not allow you to exceed certain parameters, as attempting to do so would result in an invalid strategy. This is a built-in safety net and you would receive a notice similar to:
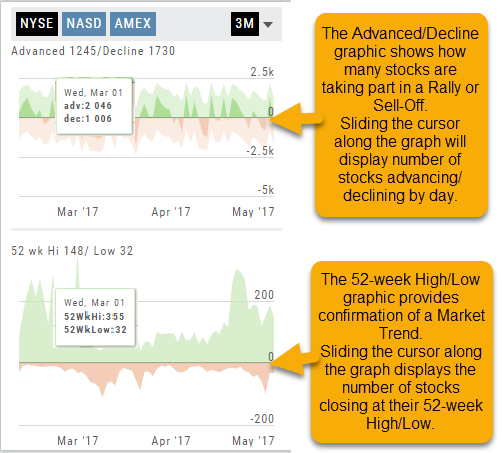
Advanced/Declined & Highs/Lows
The Graphs on the left side of the Market page can provide confirmation of whether there was a Rally or Sell-Off in the time frame selected by providing the numbers of stocks taking part in of the movement.
The 52-week High/Low Graph further confirms if there is a Market Trend by showing how many stocks closed at their 52-week High/Low.
Note, you can select a 1, 3 or 6 Month or 1 Year time frame in which to view the data. By sliding the cursor along the horizontal ‘0’ (zero) line on each graph, data for each day will appear.
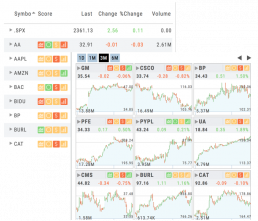
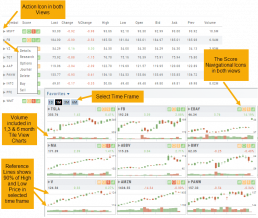
List or Tile View
View any list in traditional List View or Tile View —both show The Score.
Tile View shows thumbnail charts of the entire list. These can be viewed in a variety of periodicies. Volume is included in the 1, 3 & 6 month views to assist with quick analysis. Horizontal Reference Lines show where the Low Price and 90% of the High Price points the stock had for the selected time period.
The Score icons are also navigation shortcuts which will take you directly to Charts, Inner Circle, Valuation or Fundamentals.
Clicking on the Action Icon ![]() next to the Stock symbol in either the List or Tile View will bring up a menu offering additional choices for that Stock.
next to the Stock symbol in either the List or Tile View will bring up a menu offering additional choices for that Stock.