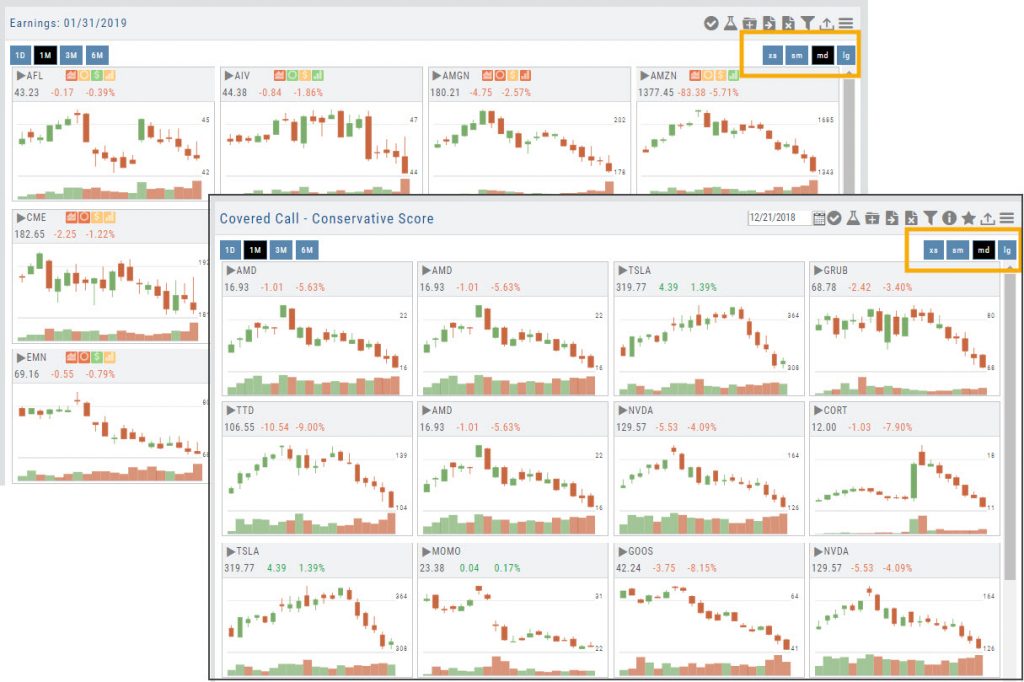
Tile View Sizes
Tile View is available in 3 sizes on the Market or Watch Tabs.
Scans and Earnings/Dividends Calendar under the Find tab offer 4 Tile View sizes: Extra Small to Large.
The platform’s adaptive and responsive technology will automatically adjust the number of tiles shown based upon the available space as well as allow continual scrolling for large lists.
Smart Action Icon
The Smart Action Icon ![]() adjusts available features depending upon where you are in the trading platform.
adjusts available features depending upon where you are in the trading platform.
For Stocks you can ‘Buy’, ‘Sell’, view ‘Options’, etc. 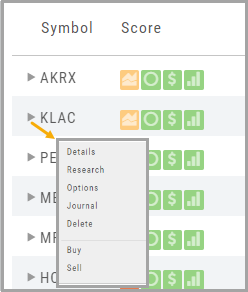
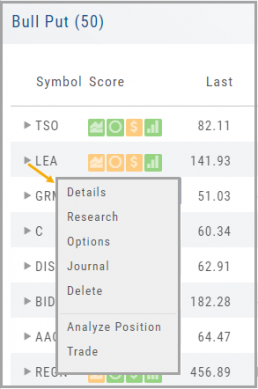
Any Strategy-specific options scan will have ‘Analyze’ and ‘Trade’ in the Action Icon Menu. You can click ‘Analyze’ to see the trade in the options chain. From there, you can Edit the structure or click ‘Trade’ to submit the trade to your to Brokerage Account and Journal.
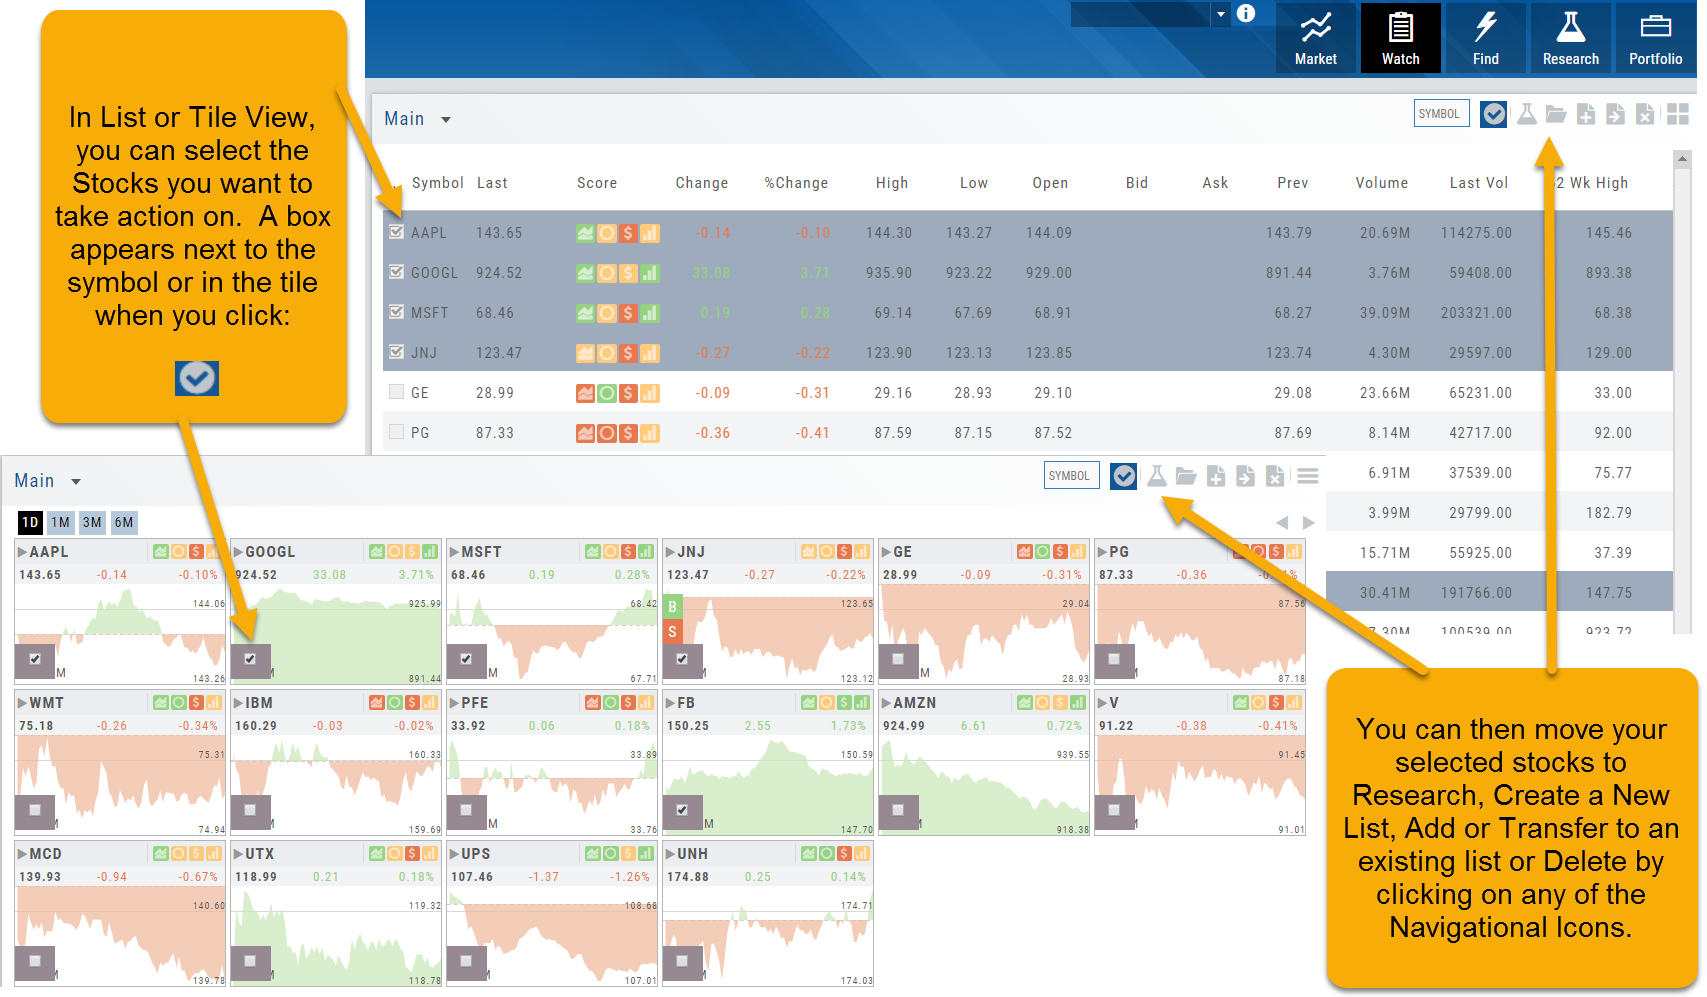
Sending from One “List” to Another
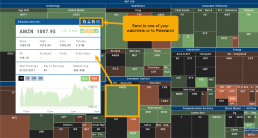
You can send symbols from any list, including Find, Explore, Actives, to your Watch lists — including from one watch list to another.
Simply (1) click the “Check” icon, (2) select the symbol(s), (3) click the “Page/Arrow” icon and select the List you want the selections sent to.
You can also ‘Click & Drag’ – highlighting a group of symbols you want moved to another list, or to the Research Tab.
Note: Research can handle up to 20 stock symbols at a time.
Don't Know the Symbol?
No Problem
You can search for symbols from several entry points including “Market” and “Watch”. Simply start typing all or part of the Company’s name and the system will proactively provide you with suggestions. You can use this feature anywhere including Insiders and Institutions.
For example, typing “Bank” in the Symbol box will bring up the stock symbols and names of companies with “bank” in their name.
Depending where you are in the Platform, clicking on the selected symbol while you are in:
The “Market” or “Watch” tab, it will be added to your currently open list of stocks.
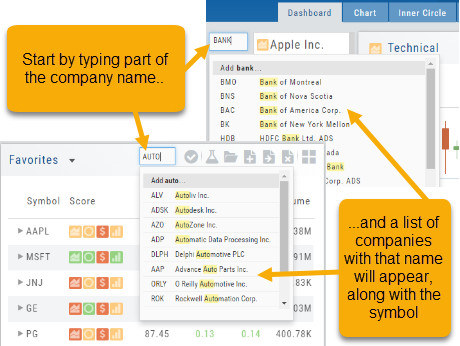
The Dashboard of the “Research” Tab, it will automatically provide the top layer of information on the stock. As always, you are able to navigate to different areas or ‘drill down’.
Insider or Institutions of the “Research” Tab, the corresponding data will display, such as data by Quarter, the biggest buyers and sellers and more.
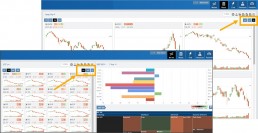
Multi-Select Stocks
Multi-select lets you choose a group of stocks. Once selected you can go to research, send to another list, create a new one, or delete from the list. This feature is also available in “Tile View”
You can also multi select using click/drag or control click in the List View.
Heat Maps Too
The Heat Maps on the Market page offer the ability to drill down to the stock level. You are able to do this with both the Map and Spectrum views. Clicking on a stock will also show the quote detail. From this you can also send to a list or research.