Platform Features Release: Enhanced Annotation Capability and Indicator Settings
Announcing the latest features/functions updates, additions or edits to the trading platform:
Enhanced Annotation Capability
Additional features have been added to create Annotations, Trendlines and Notes on the Chart. Each can be customized by color, size and easily placed on individual charts.
Volume and Moving Average Indicator Updates:
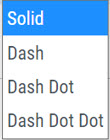
Users have the ability to further differentiate Moving Averages on the charts by changing the type of Line.
Volume can now be selected as an Upper Indicator and/or Lower Indicator
Enhanced Annotations, Trendlines, Notes & Fibonacci capabilities
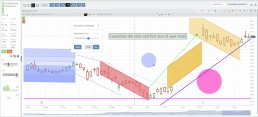
Additional & Enhanced Tools for Charting
Enhanced Annotations, Trendlines, Notes & Fibonacci Retracements allow you to customize and edit for greater flexibility on your charting.
Rays, Horizontal Lines and Arrows have been added. All allow you to select the color and thickness of each for greater differentiation on the charts. Easily reposition with a simple click and drag to new location.
Notes can be text and color edited as well as repositioned.
Parallel Lines have been added and they, along with Fibonacci Retracements – allow you to customize the color and transparency on the charts.
Edits are easy: Click on the entry, edit as needed on the Annotation Box – which can be moved anywhere on the platform- as needed, to make any changes.
Volume and Moving Average Enhancements
Customize your Moving Average indicator Lines – not only by color – but by the type of line:
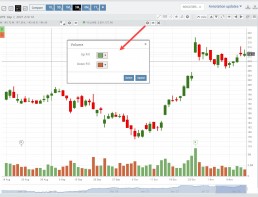
Volume, already available as a Lower Indicator, can be added as an Upper Indicator on the charts.
In addition, the Volume bar colors can be customized as they are an independent indicator from the candlesticks. This is done by clicking on the gear icon, as shown.
Change Log
- Added Stock/ETF symbol to Option Chain Window
Position Indication on the Chain
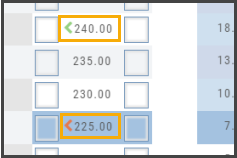
When evaluating an existing position on the options chain, the positions held are indicated with arrows on the chain. The arrows point to the quantity entry box of the held position.
Green arrows ![]() indicate Long or Buy positions.
indicate Long or Buy positions.
Red arrows ![]() indicate Short or Sell positions.
indicate Short or Sell positions.
Advanced Indicators
We offer select Advanced Upper and Lower Indicators that are not just derived from the price, including proprietary indicators like “Invest4Score” and “Insider Score”. They are accessible by using the “Add Indicator” drop-down box.
Upper Indicators include:
- Event Flags – showing Earnings and Dividends
- Journal Display
- Support/Resistance
- Extrema Trend Lines
Lower Indicators include:
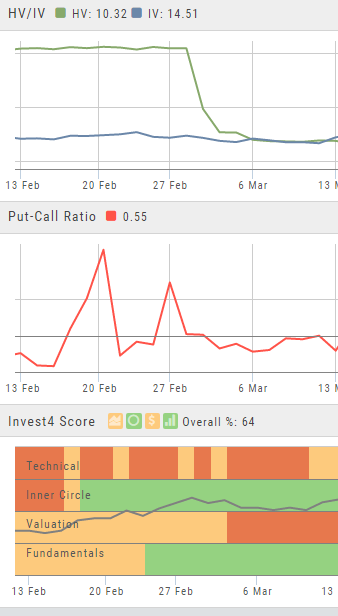
- Historic Volatility/Implied Volatility
- Insider Score
- Institutional Percentage
- Invest4 Score
- Momentum Score
- Open Interest
- Options Volume
- Put Call Ratios
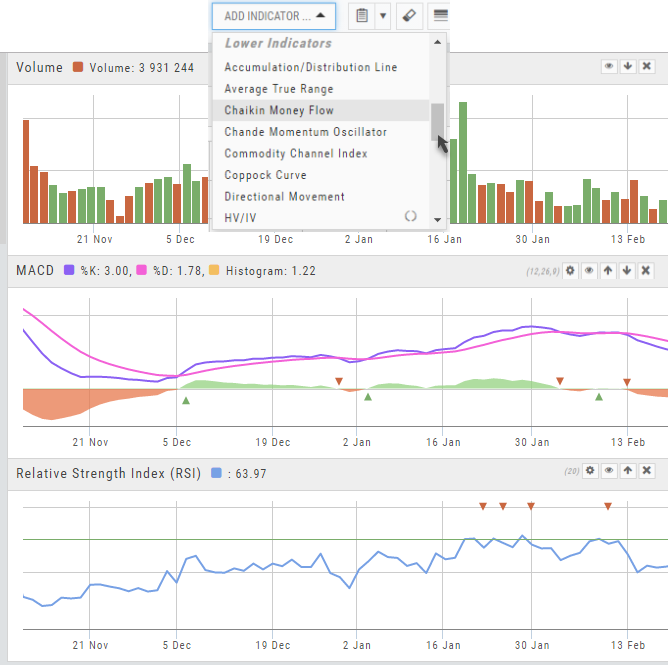
Lower Indicators
The “Add Indicator” drop-down box has a section of Lower Indicators you can add below the main chart.
Many of the Indicators allow you to customize the parameters prior to adding.
Once the Indicators are in place, the icon tool bar – found on the upper right above each graph- gives you the ability to edit (Gear), hide (Eye), move up/down (Arrows) or delete (X) to truly customize your view.
![]()
Adding & Arranging Indicators
Select ![]() to add to your studies.
to add to your studies.
Indicators are grouped by Upper Indicators (which will appear on the Chart) and Lower Indicators (listed below the chart)
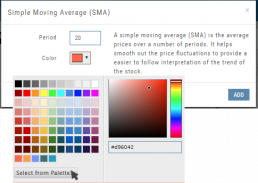
Once selected, you can customize the parameters – including the type of line you want for Moving Averages.
The upper Indicator selection summary appears above the chart and has an associated toolbar that allows edits (gear) hide/display(eye), refresh, or remove.. ![]()
Lower indicators can be displayed/hidden, move placement up/down, or delete it to truly customize your view. ![]()
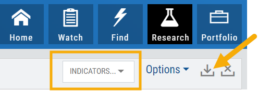
Make sure to Save Your New Chart Settings ![]()
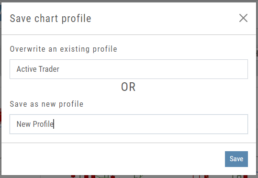
Note: You cannot alter System Views: Active Trader, Options or Standard View. You will be prompted to either Overwrite or Save as a New Profile another available profile, such as Default or another Personal View.
Trend Lines, Notes & Shapes and Advanced Annotations
Customize your charts with Trend Lines, Notes and Advanced Annotations.
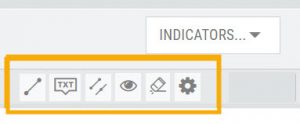 These tool icons are available above the chart, just below the Indicators drop-down box.
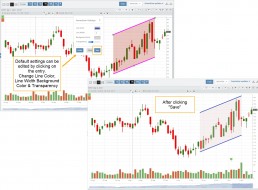
Each Annotation can have a Default Setting. This means all initially created lines, for example, will have the same settings, such as color and thickness.
Select your Annotation.
Draw it on the chart.
Click to display the dialog setting.
Adjust settings, then click “Save as Default.”
“Reset” will revert to initial settings.
You can still customize individual lines by saving the settings instead of saving as Default.
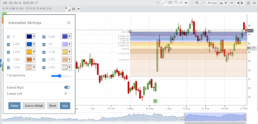
Fibonacci Too!
The Fibonacci Annotation has been enhanced to allow you to select which Retracement Levels you want to view, in addition to adjusting the color for each and the overall transparency.
The settings can be set as the Default for new chart entries or customize each entry, then “Save”.
**Please note: Existing Fibonacci annotations cannot be edited with this new coding. They must be deleted, then added back.
In addition, individual retracements can be extended Right and/or Left. Click the annotation on the chart to open the dialog box.
Note: The Extend Right/Left option cannot be set as a default setting.
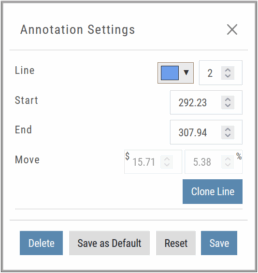
Clicking on any Trend Line, Note, or Advanced Annotation, will display the “Annotation Settings” box for that entry.
The Annotation Settings box can be repositioned elsewhere on the platform, if needed.
Line Color, Line Width and if applicable, Background Color and Transparency can be changed.
Be sure to click ‘Save’!
Note: Parallel channels are initially drawn horizontally. To change orientation click on the annotation then grab one of the ‘edit dots’ to drag to the position you wish.
Then click “Save” on the dialog box.
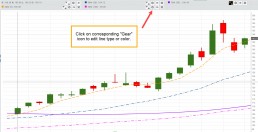
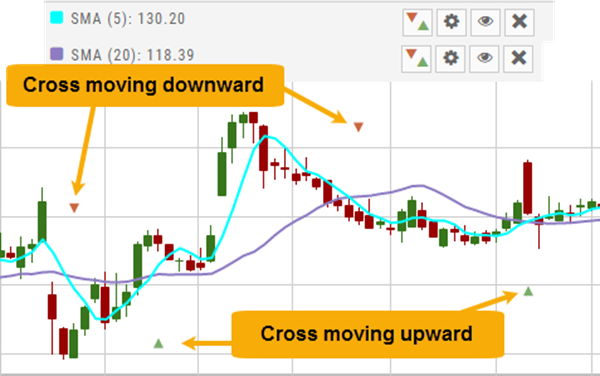
Crossover Arrows
The Crossover Arrows ![]() identify the crossover points on indicators.
identify the crossover points on indicators.
For upper indicators, you can select 2 indicators and the chart will show the crossover arrow.
Example: If you select the 5 day and 20 day SMA the Green arrows will show the 5/20 crossover points when in an upward movement, Red for downward.
Only 2 moving averages can be selected at a time when utilizing this tool. If you wish to make a change to another moving average indicator, one must first be deselected before adding the new indicator.
indication
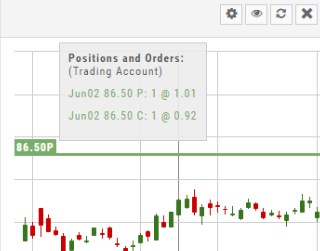
Working Orders Displayed on Chart
Charts display working orders and existing positions of selected brokerage accounts, currently Choice Trade and TD Ameritrade. More brokerages will be forthcoming.
- Stocks show a horizontal line at the entry price.
- Options show a horizontal line at the strike price.
- Green for Long and Red for Short.
The group of 4 icons, located above the Working Order, allow you to Edit (Gear), Hide(Eye) Refresh (Circle arrows) or Remove (X).
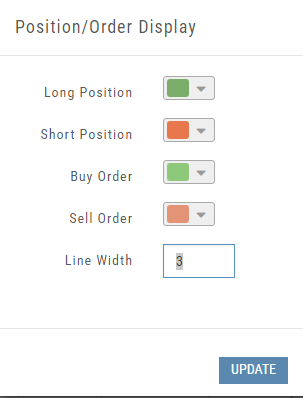
![]()
Display choices including colors and line width are available in settings by clicking the “Gear” Icon.