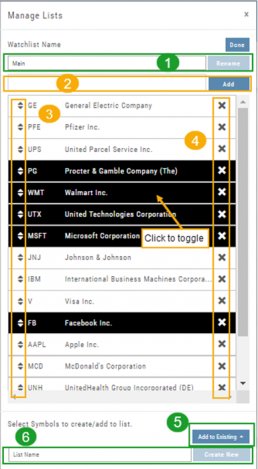
Manage/Modify Watchlists
The Modify feature offers the following Symbol and List Management capabilities in one location:
- Rename the current Watchlist
- Add Symbols to the current Watchlist
- Use up/down arrows to drag/rearrange symbols in selected List
- Remove symbol(s) by clicking on ‘X’
- Highlight symbol(s) to add to another Existing Watchlist
- Highlight symbol(s) to Create a New Watchlist
Bonus! You can keep your Watchlist sorted by any heading using this feature:
Select your Watchlist
Sort by any Heading (Example: Price – High to Low)
Click on the Manage Icon, then click “Done” at the top of the screen
This setting will be ‘sticky’ until you change it.
Industry Performance Bar Chart
The Bar Chart is located on the Market Tab and updates dynamically with selected Heat Map Index and Time Frame. This provides an additional view of the overall Market by Industry. Below is a 3 month Heat Map/Bar Chart view of the S&P 500. The bottom Bar Chart shows a 6 month view.
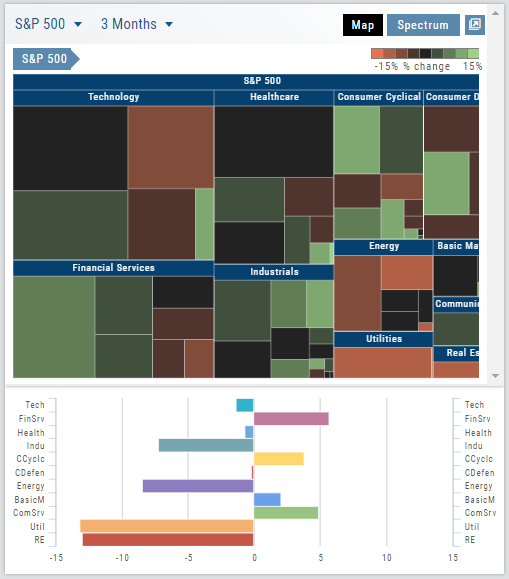
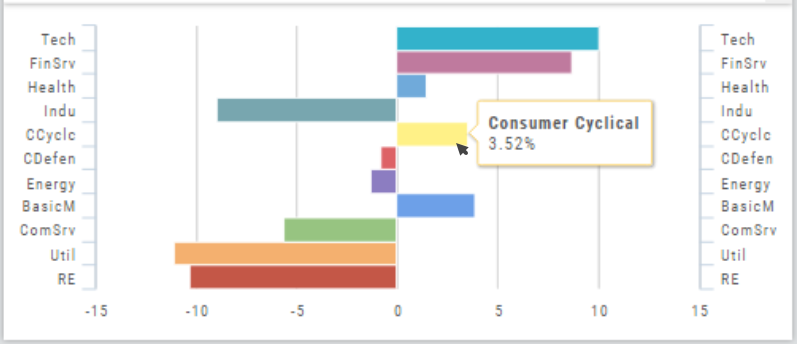
Each Industry is represented by a unique color and are listed by Market Cap – largest on top to the smallest at the bottom. Hover your cursor over each bar for the Industry name and % change of the selected time period to appear.
The center of the Chart is Neutral and will appear blank just prior to the Market’s Opening Bell. Bars extending right of center represents Gains, left of center represents a Loss for the time period selected on the Heat Map.
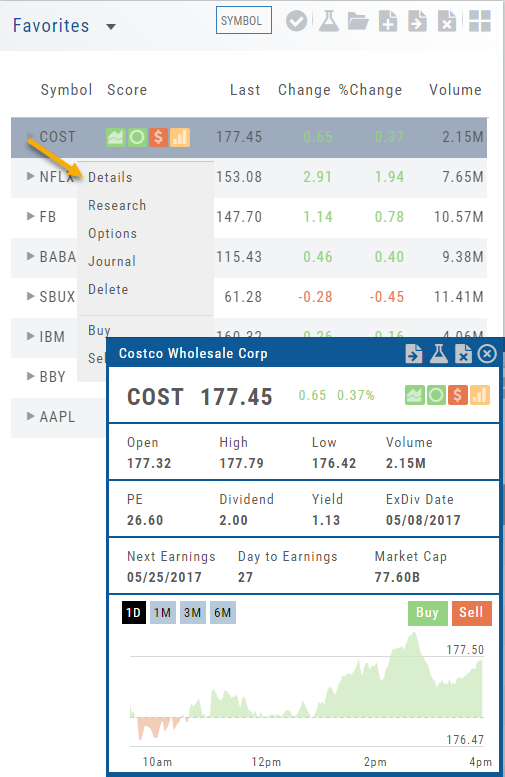
Quote Detail without leaving the List
A quick snapshot of a stock with navigational tools.
The Action Arrow Icon will provide a pop-up Quote Detail window including the current price, trading volume, Dividend Date -if applicable, Earnings Date and more. A chart, on the bottom part of the Detail Box, allows for difference periodices: 1 Day, 1,3 or 6 Months.
Notice the additional icons in the Quote Detail: You can send this stock to one of your Watch Lists, to Research or delete the stock if you wish. The Score Icons will direct you to the appropriate Research function. Buy/Sell buttons allow for quick order placing.
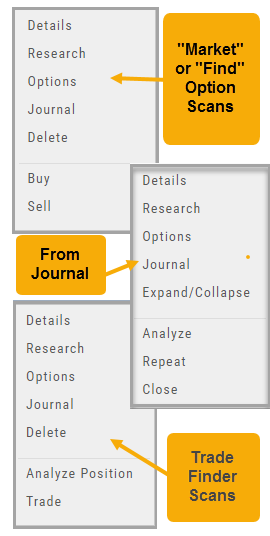
Other Navigation
Icons = Navigation
The Action (Arrow) icon will provide different actions depending on where you are in the platform. For example if you are in the Market or Find tab, ‘Detail‘ will provide a Quote Popup. ‘Research‘ will take you to the Dashboard – overview – of the stock. ‘Options‘ will take you to that part of the platform etc.
When in a “Trade Finder Scan” (identified by the ![]() icon), the Action icon choices includes: ‘Analyze Position’ which will take you to the Options tables and/or ‘Trade’ which will lead you to the Order Ticket of the Brokerage Account from the menu.
icon), the Action icon choices includes: ‘Analyze Position’ which will take you to the Options tables and/or ‘Trade’ which will lead you to the Order Ticket of the Brokerage Account from the menu.
The Action Icon is also found in the Journal. Under the “Positions” tab, clicking on the icon allows you to Expand/Collapse details of the trade, Analyze or Close the trade among other choices.