Trading Sandbox Account - Overview
Unlike traditional broker-provided virtual accounts, the Sandbox is not bound by brokerage margin rules or limitations, giving you more freedom to practice and test strategies.
Trading Sandbox Account was built specifically to overcome these shortcomings, allowing traders to:
-
Test advanced strategies without brokerage-imposed limits.
-
Gain confidence in how options positions will behave through expiration and assignment.
-
Track true results on completed trades for more effective learning and analysis.
As with other simulated trading systems, the Sandbox uses delayed market data. However, it goes beyond conventional paper trading platforms in several key areas:
Fast & Reliable Order Execution
Orders are processed quickly during market hours, creating a more realistic trading experience compared to laggy paper trading systems.
Supports Conditional Orders for Stocks
Effortlessly include Stop and Limit Orders when buying stock.
Options Handling That Works
Options are properly assigned and exercised as they would be in a real account, removing the gaps found in most brokerage simulators.
Accurate Trade Capture
The Sandbox records and captures gains/losses on completed trades, giving you a clear picture of how your strategies perform over time.
Full Journal Support
When auto-journaled (default setting) is set, all activity is captured. Track your progress to see what strategies work, what needs more practice, for important feedback.
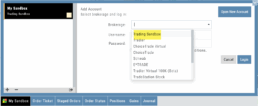
How To Add:
Sandbox has been added as a drop-down selection in the Portfolio section of your trading platform
-
Click the bottom left corner tab of the platform to display all account tabs
-
Click the “+” icon appearing below these tabs
-
Select “Sandbox” from the dropdown list. Check the “I agree…” box
-
Name your account and select a color identifier, if desired.
-
Start trading!
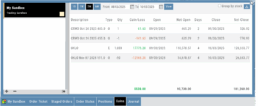
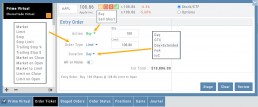
The Order Ticket - Stock/ETF
The Order Ticket is designed for ease of use and flexibility.
Selecting “Stock/ETF” or “Options” will display the appropriate ticket.
Brokerages determine what Order Types and Duration selections are available.
All or None allows you to dictate whether to accept partial fill of an order or not. Toggle to turn this on/off.
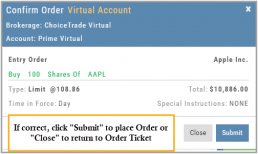
The Order Summary appears below Order details as an additional security step to ensure your order is correct.
Click “Stage” for later review, “Review” to continue the Order process or “Clear” to start over.
Note: If you start an Order in one account, then switch accounts, you’ll review the following notice: 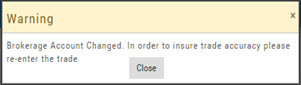
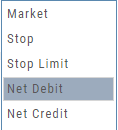
Order Types are in a drop-down box and the types offered often vary from one brokerage to the next.
‘Duration’ – How long the order is good for: Day (current trading day) or GTC (Good til Cancelled) 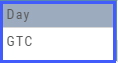
‘Condition’ – Must be met for the order to be filled/executed: “None” (no conditions) or “All or None” (all of the order must be filled, or none at all).
 After completing the order ticket, click ‘review’, then ‘submit’.
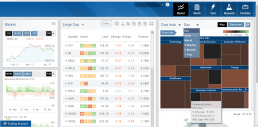
Market - The Big Picture
Start here for the overall outlook.
Designed to show what the overall markets are doing by viewing the graphs, charts and maps. You can change the time frame to check trends, use the maps on the right side of the page for a picture of sectors in relation to the market. Even drill down to industry within the sector and more.

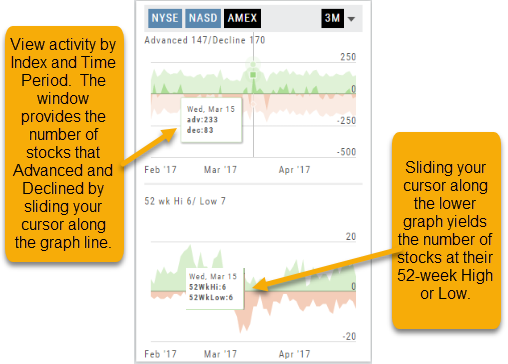
Market Overview: Get more of a broad view
View activity of the NYSE, Nasdaq or American Stock Exchange by time frame. The upper area of this part of the Market Tab shows the number of advancing or declining stocks by sliding your cursor along the graph.
Likewise, the bottom portion of shows the number of stocks that reached their 52-week High or Low by sliding your cursor along the lower graph.
The constant figures show the number of stocks in each category for the current/most recent trading day.
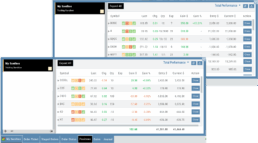
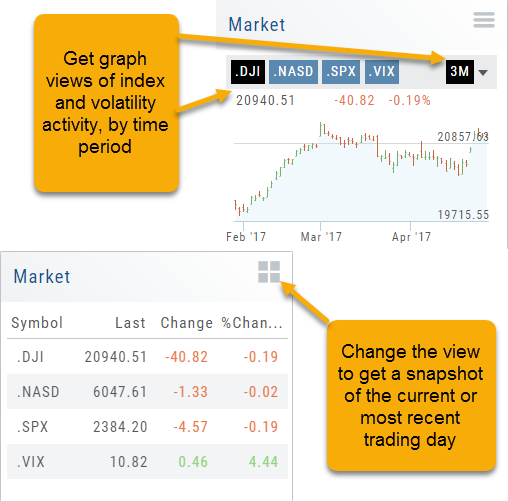
Market - Index Overview
In the default Graph View, get an visual view of Market or Volatility Index activity by a 1-day or 1, 3 or 6 month time frame. By sliding your cursor along the graph, an activity box will display more in-depth activity: Every two minutes for the 1-Day Graph, or Daily for the 1, 3 or 6 month graph.
The current market activity/most recent trading day, regardless of time-frame, is present on the default view under the Index box selections – or by selecting the List View to get: Current, point change and percentage change (green = positive, red= negative).
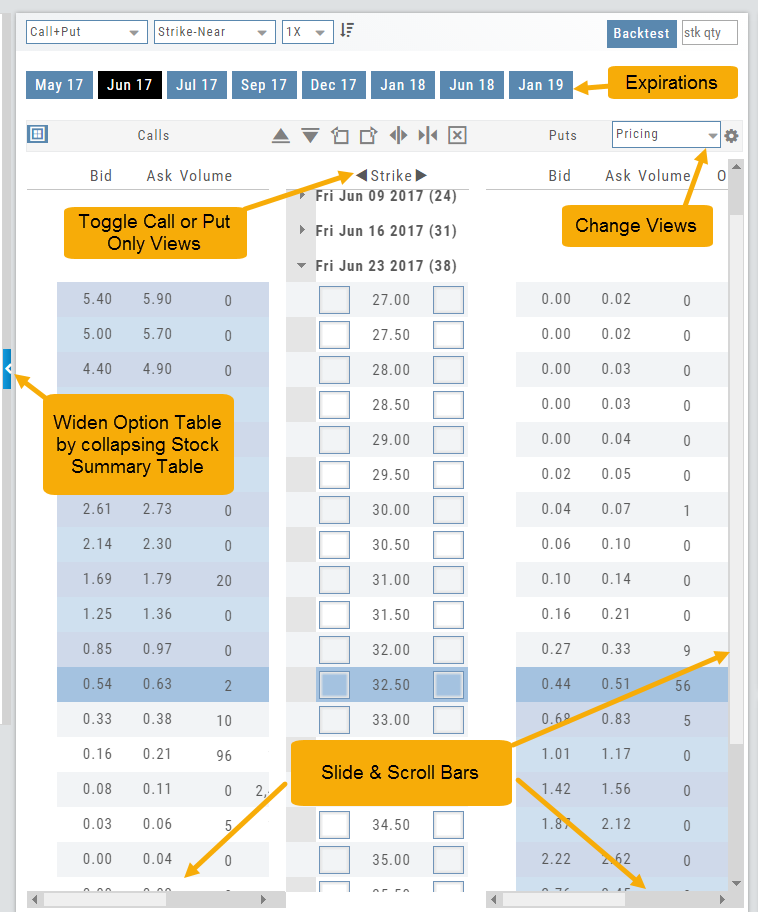
Options Navigation
Expirations are displayed above the Option Table.
Select the months to view by clicking on the appropriate box. All available dates are displayed. Remember, the further out the option expiration is, the fewer dates are available.
Toggle between Calls Only or Puts Only view.
Change Option Table views to Pricing, Value, Greeks, Trade or new Custom views you create to suit your needs.
The small tab on the left side of the table will collapse the stock summary box & widen the option table.
The scroll bar on the right side and slide bars at the bottom on the table offer additional navigation.
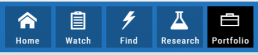
Top Level Navigation
Designed so trading workflow makes sense.
Home provides an overview of the current market from charts to maps and customize your own view.
Watch more detail of selected stocks matching overall outlook.
Find identify opportunities from scans, strategies, outlook and more.
Research gives you all the detail you need on the intuitive Dashboard
Portfolio keeps your accounts, trades and journal in one place.
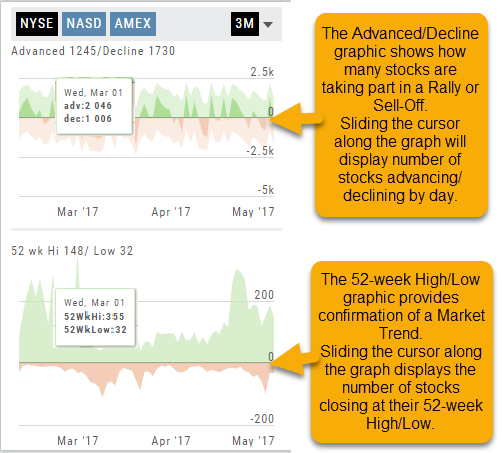
Advanced/Declined & Highs/Lows
The Graphs on the left side of the Market page can provide confirmation of whether there was a Rally or Sell-Off in the time frame selected by providing the numbers of stocks taking part in of the movement.
The 52-week High/Low Graph further confirms if there is a Market Trend by showing how many stocks closed at their 52-week High/Low.
Note, you can select a 1, 3 or 6 Month or 1 Year time frame in which to view the data. By sliding the cursor along the horizontal ‘0’ (zero) line on each graph, data for each day will appear.
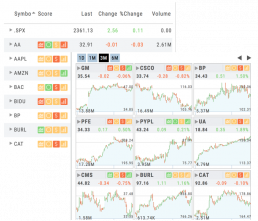
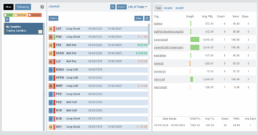
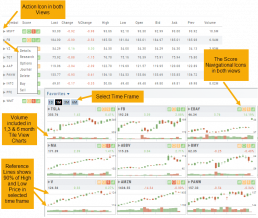
List or Tile View
View any list in traditional List View or Tile View —both show The Score.
Tile View shows thumbnail charts of the entire list. These can be viewed in a variety of periodicies. Volume is included in the 1, 3 & 6 month views to assist with quick analysis. Horizontal Reference Lines show where the Low Price and 90% of the High Price points the stock had for the selected time period.
The Score icons are also navigation shortcuts which will take you directly to Charts, Inner Circle, Valuation or Fundamentals.
Clicking on the Action Icon ![]() next to the Stock symbol in either the List or Tile View will bring up a menu offering additional choices for that Stock.
next to the Stock symbol in either the List or Tile View will bring up a menu offering additional choices for that Stock.
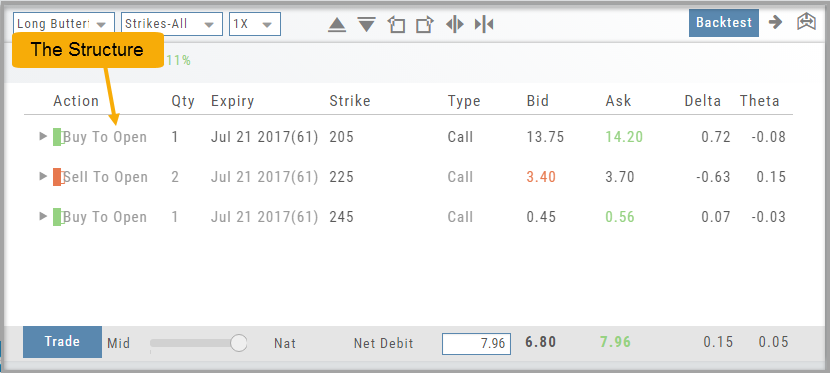
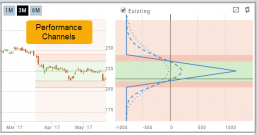
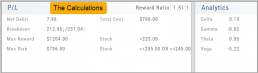
Storyboard of the Strategy
We also display a storyboard-like view of the selected strategy. It is a combination of chart, risk graph, and performance channel constructed within one panel.
This storyboard gives you the full picture of the position: The Structure, Performance Channels and Calculations.