Strategy Snapshot
It’s the “Cliffnotes” version of your strategy
Each strategy template provides a quick reference for the construction and application of the strategy. The snapshot shows:
- what the strategy outlook is on the color-coded range from ‘Very Bearish’, ‘Mildly Bearish’, ‘Neutral’, ‘Mildly Bullish’ or ‘Very Bullish’.
- what effect ‘time decay’ and ‘volatility’ has on the strategy: ‘Increase’, ‘Neutral’ or ‘Decrease’.
- debit or credit trade
- risk & reward level
- strategy structure
- an overview summary of the strategy
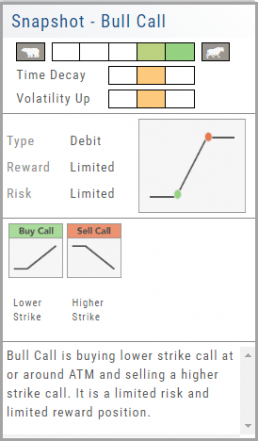
Chart Types
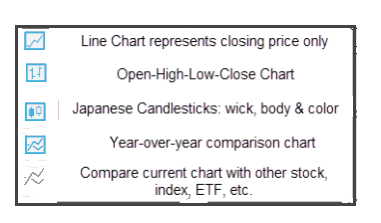
Lines, Bars, Candles & Comparisons
You have the flexibility in not only the way the data is displayed, but you also have choices in comparisons: Year-over-Year comparisons of your current Stock, up to a 5-year period. You can also compare your current stock to another stock, another index, ETF, etc.
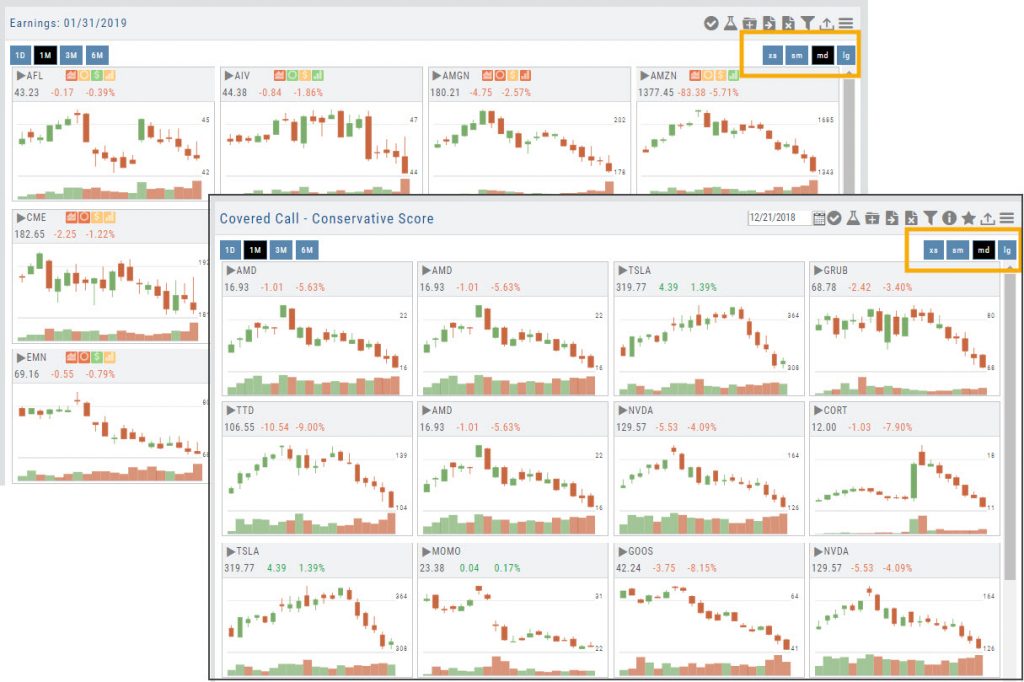
Tile View Sizes
Tile View is available in 3 sizes on the Market or Watch Tabs.
Scans and Earnings/Dividends Calendar under the Find tab offer 4 Tile View sizes: Extra Small to Large.
The platform’s adaptive and responsive technology will automatically adjust the number of tiles shown based upon the available space as well as allow continual scrolling for large lists.
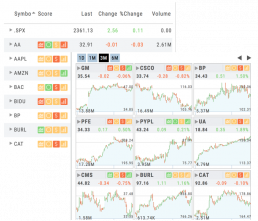
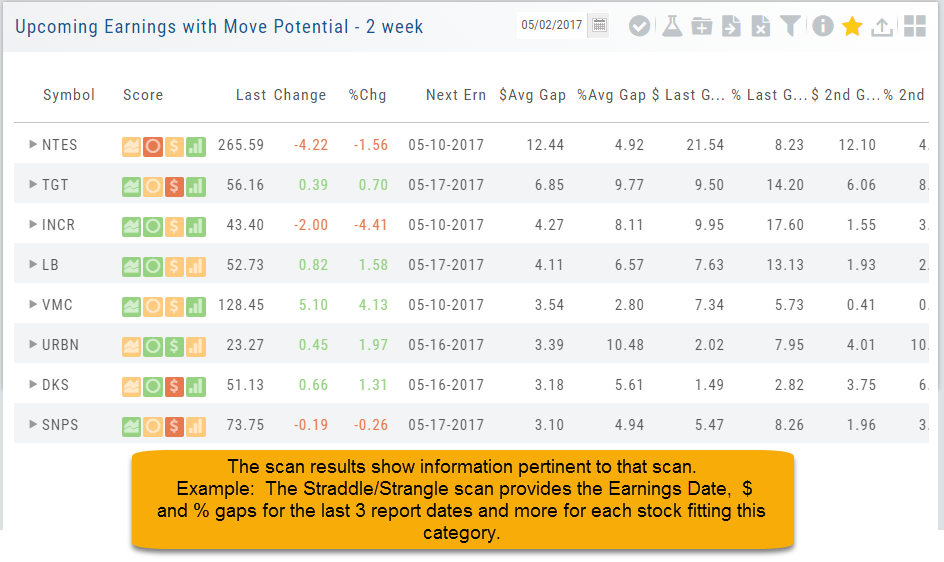
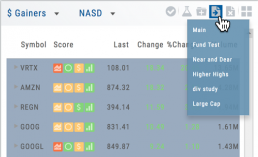
Dynamic Scan Information
The scan results provide relevant information for that scan. For example: Dividends will show Yield, Covered Calls will show the options position, potential return, net cost and more.
This allows you to quickly pick stock candidates and bypass others for high-probability trades. For example, you may wish to eliminate stocks priced too high or low, those with low volume, etc. Use the Navigational tools (Action Icon, The Score Icon, Send to Watchlist or Research for example) to dive deeper in selecting the best stock.
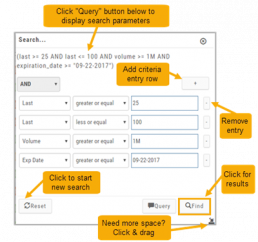
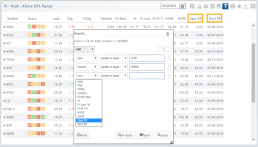
Filter Scan Icon
The Filter icon ![]() – located in the upper left area of the scan page – allows you to narrow candidates of an initial scan by applying additional parameters.
– located in the upper left area of the scan page – allows you to narrow candidates of an initial scan by applying additional parameters.
You can adjust the criteria at any time to further narrow or increase the number of results by eliminating, adding or adjusting entries.
This Smart Search feature filters data unique to the scan. Ex: Covered Calls Filtering offers Net Entry Cost, $ Return with no Movement, $ Return if Called out, etc.
Use drop-down box to select parameters and enter criteria in boxes.
Add rows if needed by clicking on ‘+’
If you need more space, click and drag the arrow in the bottom, right corner.
Click “Find”.
Click ‘Reset’ to start over. The “Query” button displays the criteria at the top of the Filter page. Click again to remove.
Give it a try!
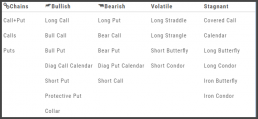
Option Tables & Templates
Expanding your Options!
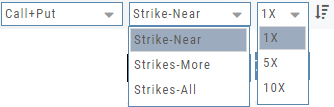
Choose from Call+Put chains, Call Matrix, Put Matrix or from almost 2 dozen Option Templates – covering any market outlook.
Expand the Strikes displayed: Near ATM, More or All.
You can change the click Quantity default increment by changing the default parameter for 1x, 5x or 10x.
You can also sort the Strike prices: Lowest to Highest, or vice-versa.
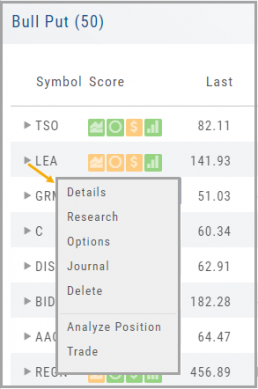
Smart Action Icon
The Smart Action Icon ![]() adjusts available features depending upon where you are in the trading platform.
adjusts available features depending upon where you are in the trading platform.
For Stocks you can ‘Buy’, ‘Sell’, view ‘Options’, etc. 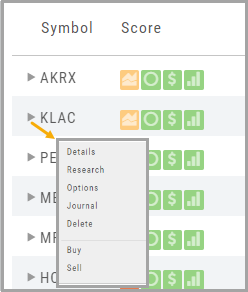
Any Strategy-specific options scan will have ‘Analyze’ and ‘Trade’ in the Action Icon Menu. You can click ‘Analyze’ to see the trade in the options chain. From there, you can Edit the structure or click ‘Trade’ to submit the trade to your to Brokerage Account and Journal.
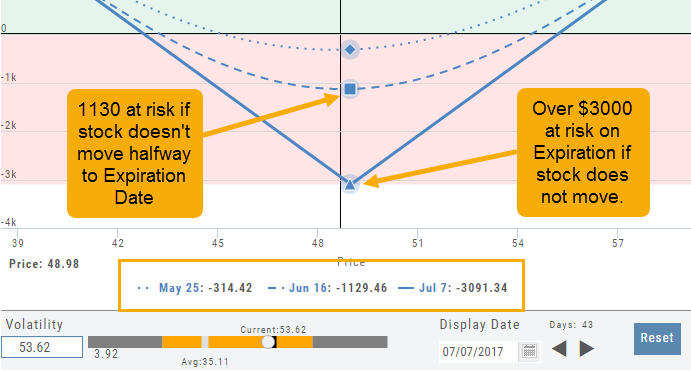
Advanced Analytics
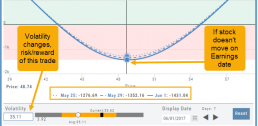
Some strategies are more responsive to time decay and/or volatility than others. This platform has tools to help analyze these components.
- Construct the position in the Option Chain table
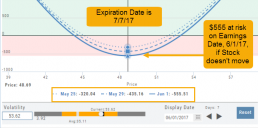
- Select the ‘Go Big’ icon on the P&L Graph
- The Graph shows 3 data points: Current Day, Halfway point to Expiration Day & Expiration Day. The corresponding legend, immediately below the graph, follows the cursor slider along the graph.
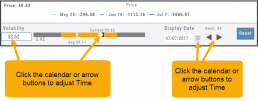
- The bottom of the screen contains a Calendar (Time) & Volatility Scale. Both can be manipulated to analyze the position.
Time: You can select a date to analyze as well as user stepper buttons to move day by day backward or forward.
Volatility: Use the volatility slider or enter a value in the entry box to see the impact of changes in volatility. The slider bar also displays the current (circle), average (gray), and 1 year high / low of implied volatility (orange portion of the slider) for easy reference.
Sending from One “List” to Another
You can send symbols from any list, including Find, Explore, Actives, to your Watch lists — including from one watch list to another.
Simply (1) click the “Check” icon, (2) select the symbol(s), (3) click the “Page/Arrow” icon and select the List you want the selections sent to.
You can also ‘Click & Drag’ – highlighting a group of symbols you want moved to another list, or to the Research Tab.
Note: Research can handle up to 20 stock symbols at a time.
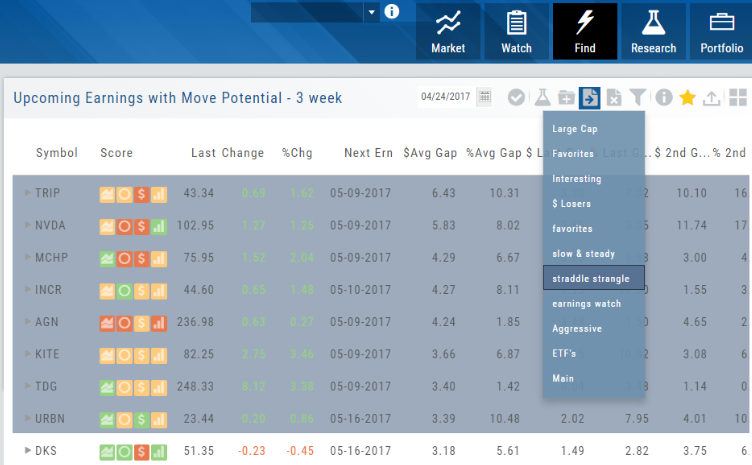
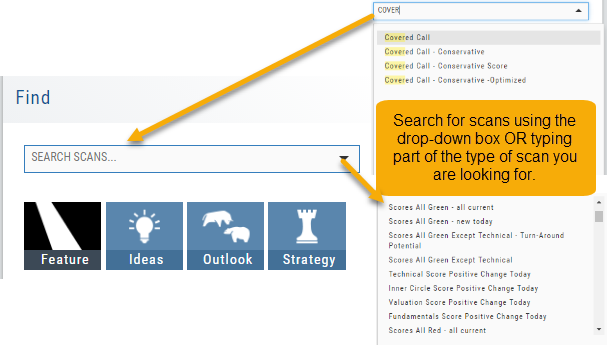
Scan - Smart search
The search box is found at the top of Find. It performs ‘smart searches’ by pulling all scans related to what is typed in. If you don’t know the name of the specific scan, but know it is related to Earning announcements, type “earning” and a list will populate showing scans that are about Earning. Typing “Bull” or “Bear” will bring up scans with “Bull or Bullish” or “Bear or Bearish” in their names, respectively.
Of course, you can also elect to search by clicking the arrow for a complete list of available scans in a drop-down search.