Platform Features Release: July 2023
Announcing the latest Release of feature and functionality enhancements to the trading platform with the goal of improving the investment/trading decision process. These two areas of the platform have undergone a major redesign and expansion of metrics.
Key Ratio Tab(formerly Valuation)- Reworked and expanded data points offered as well as provided context of how well a stock is performing compared to its Industry and the S&P.
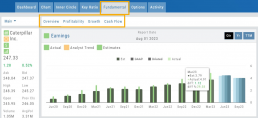
Fundamental Tab – Improved display of the expanded data available offer the ability to view fundamental metrics by Quarter, Year or Trailing Twelve Months (TTM) with the ability to adjust the time period and data display views.
Register for Office Hours, Wednesday, July 12th
Join us for a special Office Hours session, Wednesday, July 12th at 4:15 Eastern (15 minutes after Market Close)
Rance will be showcasing the Key Ratio and Fundamental tab data – how to read, understand and utilize the metrics provided.
Register using the button below. A confirmation email will be sent with a link to join for the scheduled time.
Key Ratio Tab
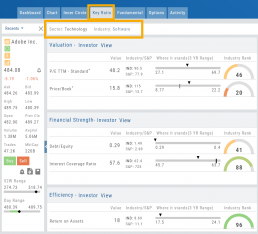
Key Ratio analysis is just one approach to evaluating stocks, and it should be complemented with other forms of analysis, such as technical analysis and market sentiment, for a well-rounded investment decision.
Key ratio indicators provide valuable information about a company’s financial health, profitability, growth prospects, operational efficiency, and overall value enabling traders to make more informed decisions:
Valuation: Helps determine whether a stock is priced attractively in relation to its earnings, sales, or book value.
Profitability: Signifies a company’s ability to generate returns for its shareholders.
Financial Strength: Assesses the ability to meet financial obligations and weather economic downturns.
Growth: Analyzes potential for expansion and increased earnings over time.
Efficiency: Measures how effectively a company utilizes its resources to generate output.
Cash Flow: Provides insights into the company’s ability to generate and manage cash.
Fundamental Tab
Fundamental Analysis involves a comprehensive examination of a stock’s financial health and its underlying value, as well as other relevant financial and non-financial metrics, to form an overall view of a company’s financial health and value.
This information is displayed in charts and graphs making it more useful in the analysis process.
It’s important to note that fundamental analysis is just one approach to evaluating stocks, and it should be complemented with other forms of analysis, such as technical analysis and market sentiment, for a well-rounded investment decision.
Enhancements
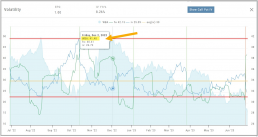
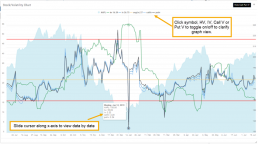
Price has been added to the Volatility Chart on the Option Chain display. Slide your cursor along the chart to display the Date, Price, HV & IV
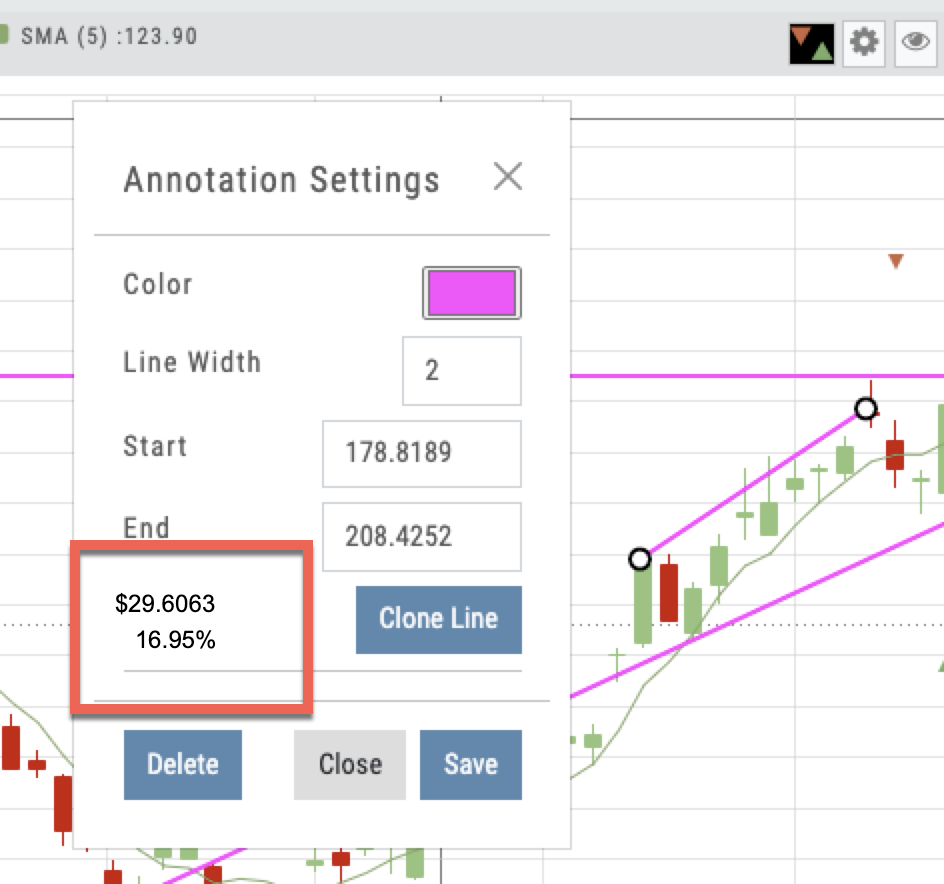
Dollar and Percentage Move added to Line Settings:
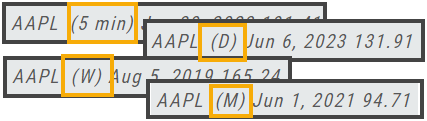
Timeframe displayed on chart when not on “Favorite”:
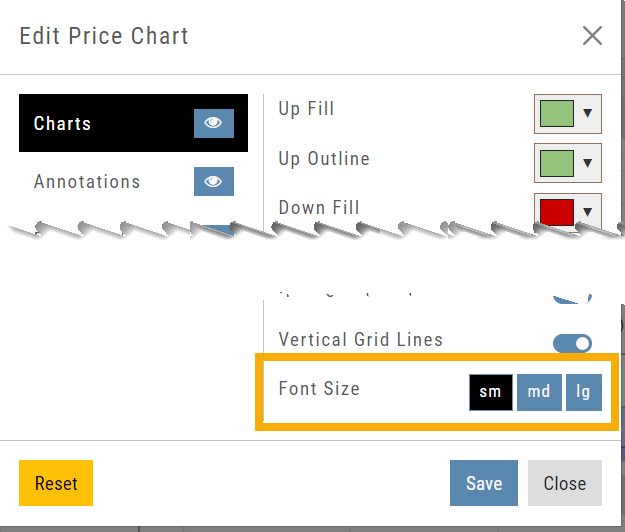
Font Size Selector for Price Chart
Vega added to Strategy Templates. Click the ‘expand’ icon, if needed:

Change Log
- Linear Regression Channel period number updating
- Roll-out time icon synced with Risk Graph
- Added “No or Limited Dividend Information” message
- Corrected Backtest Net Debit/Net Credit responsiveness
- Reset button function restored on Projected Price
Advanced Analytics
Some strategies are more responsive to time decay and/or volatility than others. This platform has tools to help analyze these components.
- Construct the position in the Option Chain table
- Select the ‘Go Big’ icon on the P&L Graph
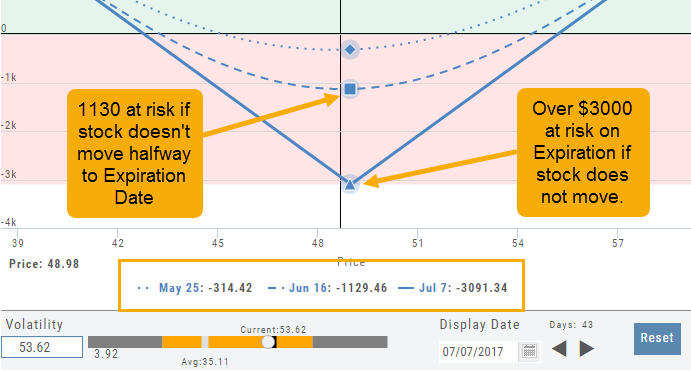
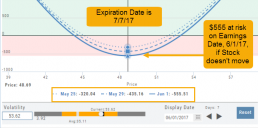
- The Graph shows 3 data points: Current Day, Halfway point to Expiration Day & Expiration Day. The corresponding legend, immediately below the graph, follows the cursor slider along the graph.
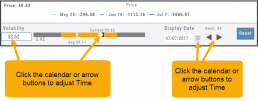
- The bottom of the screen contains a Calendar (Time) & Volatility Scale. Both can be manipulated to analyze the position.
Time: You can select a date to analyze as well as user stepper buttons to move day by day backward or forward.
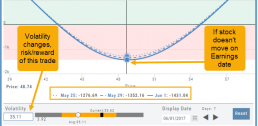
Volatility: Use the volatility slider or enter a value in the entry box to see the impact of changes in volatility. The slider bar also displays the current (circle), average (gray), and 1 year high / low of implied volatility (orange portion of the slider) for easy reference.
Evaluate Existing Positions
Positions will automatically show on the options chain for the active brokerage account.
You can also access directly from Broker Positions. Select “Analyze” from the Action menu. 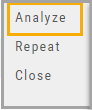
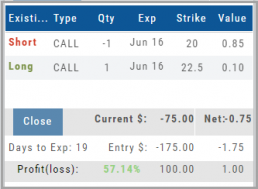
This will display the current values as well as entry cost and current P/L.
Here you can also close the position or evaluate adjustments on the trade.
Position Indication on the Chain
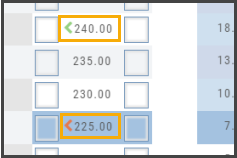
When evaluating an existing position on the options chain, the positions held are indicated with arrows on the chain. The arrows point to the quantity entry box of the held position.
Green arrows ![]() indicate Long or Buy positions.
indicate Long or Buy positions.
Red arrows ![]() indicate Short or Sell positions.
indicate Short or Sell positions.
Snapshot: Comparing Positions
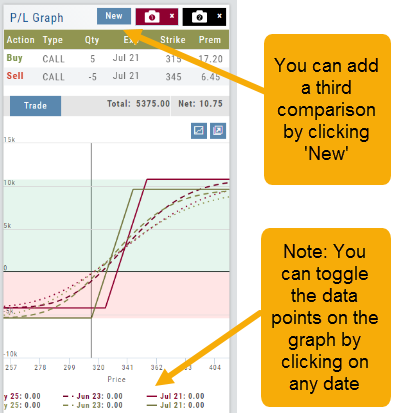
The Snapshot feature gives you the ability to compare up to three scenarios in one view without having to change screens or erase previous setups. You can even submit a trade from this part of the platform!
- From the Calls+Puts chain (as well as “Calls” or “Puts”) enter the initial trade position.
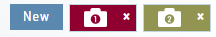
- Next click one of the camera icons:
- Repeat the first step using the Rolling Icons to adjust the initial position to a new scenario:
- Click the 2nd camera icon & repeat the above steps for the last trade comparison.
Note: The position lines are color coded to match the Snapshot (or New) icon.
Once you decide on the optimal position, click ‘Trade’ from the P&L Graph and you’ll be taken to the Order Ticket of your brokerage account with the option information auto-filled. 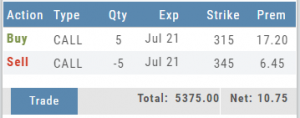

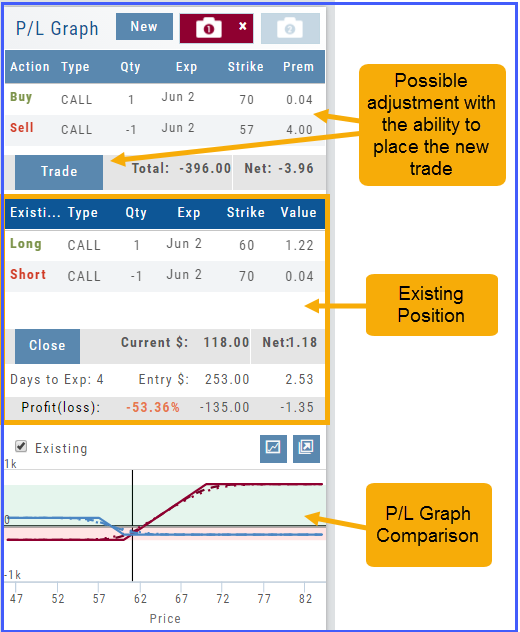
Trade Management
This platform makes it easy to manage and adjust trades when needed. The Snapshot feature and the P/L graph enables you to visually assess adjustments.
Once the existing trade is showing on the options page, take a ‘snapshot’. Enter the adjustment, then take another ‘snapshot’.
To submit the adjustment to the Order Ticket of your brokerage account, click “Trade”. The smart ticket system will even handle the trade adjustment automatically by entering the appropriate buy/sell, open/close combination. 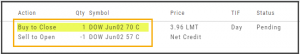
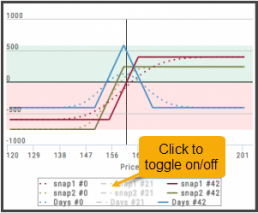
Clickable Legends
When comparing trades using the Snapshot feature, the P/L Graph can get a little crowded. You can clear some of the lines by simply clicking on the legend to toggle visibility.
Clickable legends are also available in other graphs and charts within the platform.
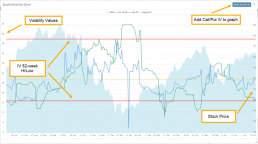
Historic & Implied Volatility
This chart displays Historic (HV) and Implied (IV) Volatility with the ability to overlay Call/Put IV
Historic Volatility (green line) is based on how the stock actually moved.
Implied Volatility (blue line) is based on how the options are priced.
When expanded, the stock chart, 12-Month Mean (Average) IV and one-year IV High/Low (red line) are also shown. This is very helpful in understanding if option premiums are comparable to historic values.
High HV indicates recent strong movement.
High IV indicates higher premium and, in many cases, anticipated movement.
Note: You can remove the Stock Chart, HV, IV or Call/Put IV simply by clicking on the corresponding indicator above the chart/graph.
Trading from the Option Template
From Template to trade is easy. 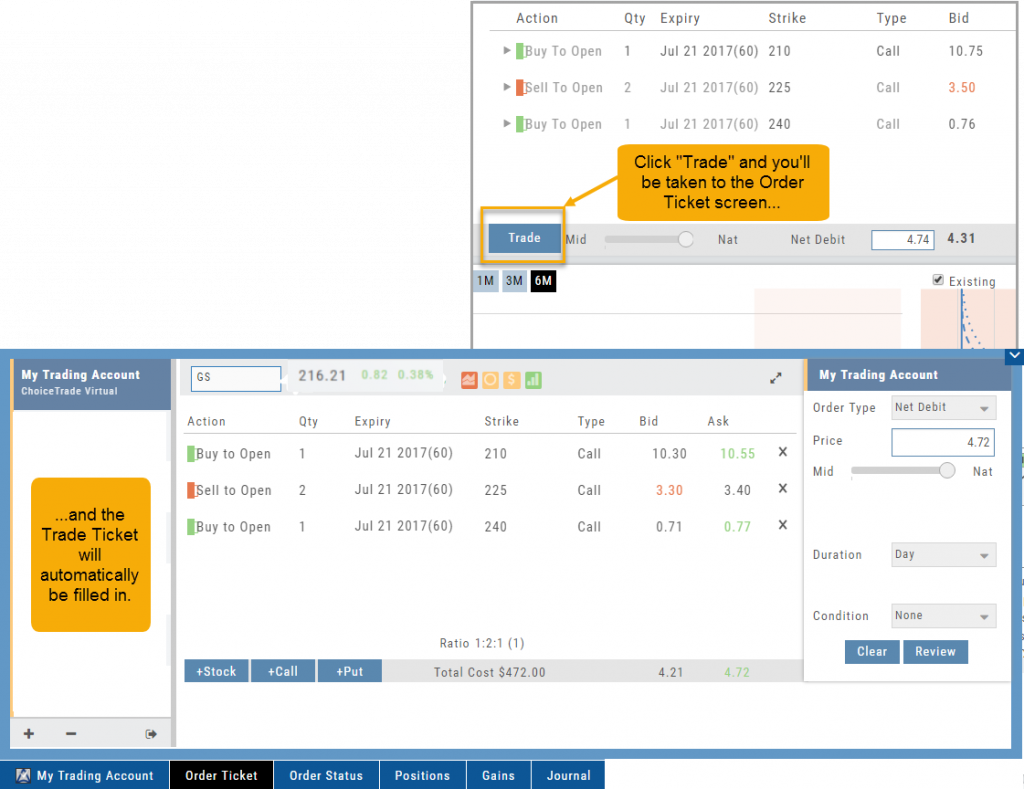
Simply click the “Trade” button on the Option Template and the Order Ticket will be filled in for you. This not only saves time, but eliminates order entry errors.
You can connect directly to select brokerage firms right from the platform and execute the trade.
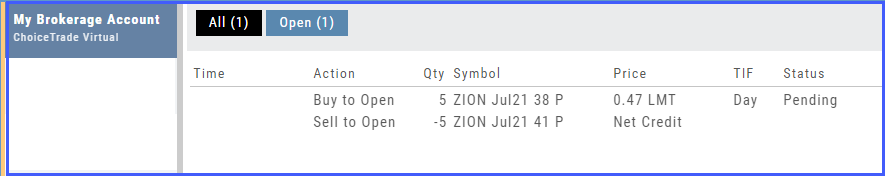
From Strategize to Analyze to Trade
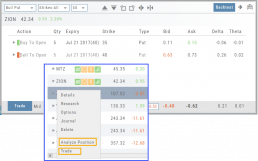
Any strategy-specific options trade will have ‘Analyze’ and ‘Trade’ in the Action Icon.
Click ‘Analyze’ to see the trade in the options chain. From there, you can edit or click ‘Trade’ to have the trade sent to the Order Ticket of your brokerage account.
Give it a try!