Some strategies are more responsive to time decay and/or volatility than others. This platform has tools to help analyze these components.
- Construct the position in the Option Chain table
- Select the ‘Go Big’ icon on the P&L Graph
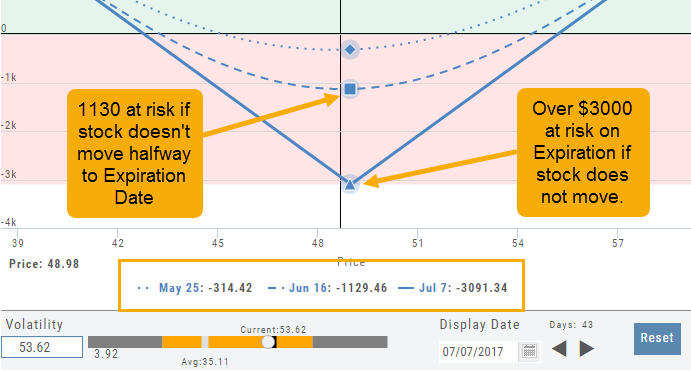
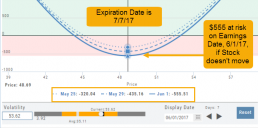
- The Graph shows 3 data points: Current Day, Halfway point to Expiration Day & Expiration Day. The corresponding legend, immediately below the graph, follows the cursor slider along the graph.
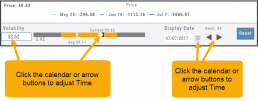
- The bottom of the screen contains a Calendar (Time) & Volatility Scale. Both can be manipulated to analyze the position.
Time: You can select a date to analyze as well as user stepper buttons to move day by day backward or forward.
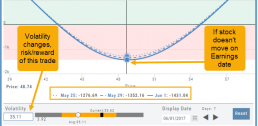
Volatility: Use the volatility slider or enter a value in the entry box to see the impact of changes in volatility. The slider bar also displays the current (circle), average (gray), and 1 year high / low of implied volatility (orange portion of the slider) for easy reference.