Inner Circle - Behind the Scenes
Insider and Institutional Activity.
Insiders’ and Institutions’ activities in a stock is a powerful tool.
Insiders: Our proprietary Insider Score looks at who the insiders are, how many there are, and how much stock is being bought or sold to derive a score algorithm.
Institutions: We monitor overall and individual institutions’ activities around a stock with historical comparison to evaluate the Institution Score. 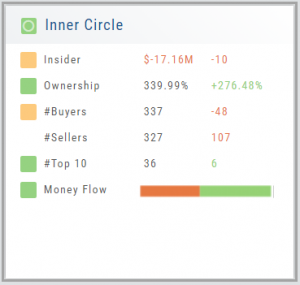
You have the ability to delve into as much information as you want by clicking on the ‘Detail’ box in “Insider Score” and “Institutions”. Find top buyers/sellers by week, month, 3 months, or one year. Search Institution Ownership by selected Quarter Report, newly added, reduced, current, top holders, etc. Dive deeper to gain insight into Institutions’ other holdings.
The information is easily accessible when you want it – just by the click of an icon, drop-down box, or arrow.
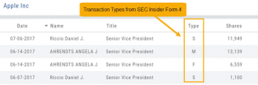
Trade Transaction Types
Type of Transaction (from SEC Insider Form 4)
General Transaction Codes
P — Open market or private purchase of non-derivative or derivative security
S — Open market or private sale of non-derivative or derivative security
V — Transaction voluntarily reported earlier than required
Rule 16b-3 Transaction Codes
A — Grant, award or other acquisition pursuant to Rule 16b-3(d)
D — Disposition to the issuer of issuer equity securities pursuant to Rule 16b-3(e)
F — Payment of exercise price or tax liability by delivering or withholding securities incident to the receipt, exercise or vesting of a security issued in accordance with Rule 16b-3
I — Discretionary transaction in accordance with Rule 16b-3(f) resulting in acquisition or disposition of issuer securities
M — Exercise or conversion of derivative security exempted pursuant to Rule 16b-3
Derivative Securities Codes (Except for those exempt pursuant to Rule 16b-3)
C — Conversion of derivative security
E — Expiration of short derivative position
H — Expiration (or cancellation) of long derivative position with value received
O — Exercise of out-of-the-money derivative security
X — Exercise of in-the-money or at-the-money derivative security
Other Section 16(b) Exempt Transaction and Small Acquisition Codes (except for Rule 16b-3 codes above)
G — Bona fide gift
L — Small acquisition under Rule 16a-6
W — Acquisition or disposition by will or the laws of descent and distribution
Z — Deposit into or withdrawal from voting trust
Other Transaction Codes
J — Other acquisition or disposition (describe transaction)
K — Transaction in equity swap or instrument with similar characteristics
U — Disposition pursuant to a tender of shares in a change of control transaction
Inner Circle - Inside Score
The Insider Score window provides insight into the buying/selling activity of Company insiders. Clicking “Detail” provides more in-depth information on such activity.
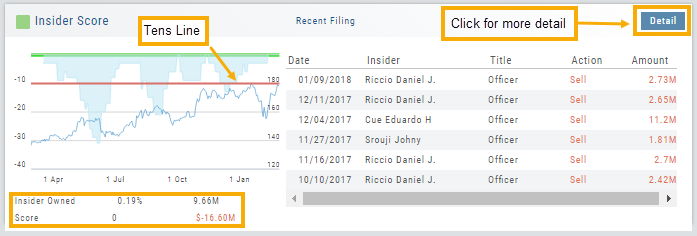
The Tens Line provides a benchmark upon which to base the Inner Circle Score.
Zero & above – indicates net buyers and thus, a Green Score.
Between zero and -10 will yield a Yellow Score, as some insider selling is normal and expected.
A Red Score indicates heavier selling outside of a normal, expected range.
The bottom left of the window shows the % of all shares that are Insider Owned, equivalent $ amount last Quarter, the Score and Net Dollar amount traded last Quarter.
Inner Circle - Institutions
While Insiders are required to update their ownership status within a few days. Institutions are required to do so Quarterly.
The main tile shows data from the most recent reporting Quarter.
% Institutional Ownership and % change (+/-) from the previous Quarter
# of Buyers/Sellers with number gain/loss.
# of Institutions where the Stock is in their Top 10 Holdings
Note the Deadline for the Q1 2018 Report.
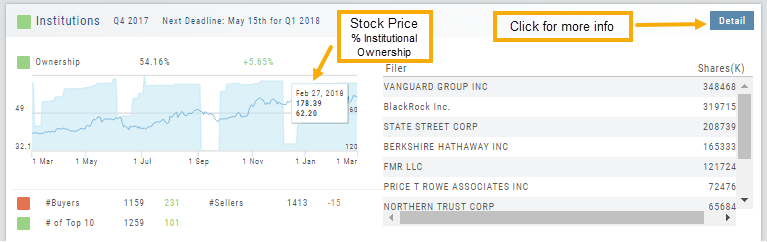
While the # of Buyers grew by 231 in Q4 2017, the number of Sellers outweighing buyers was enough to give this compenent a Red Score.
The # of Institutions holding AAPL grew enough to have a Green Score.
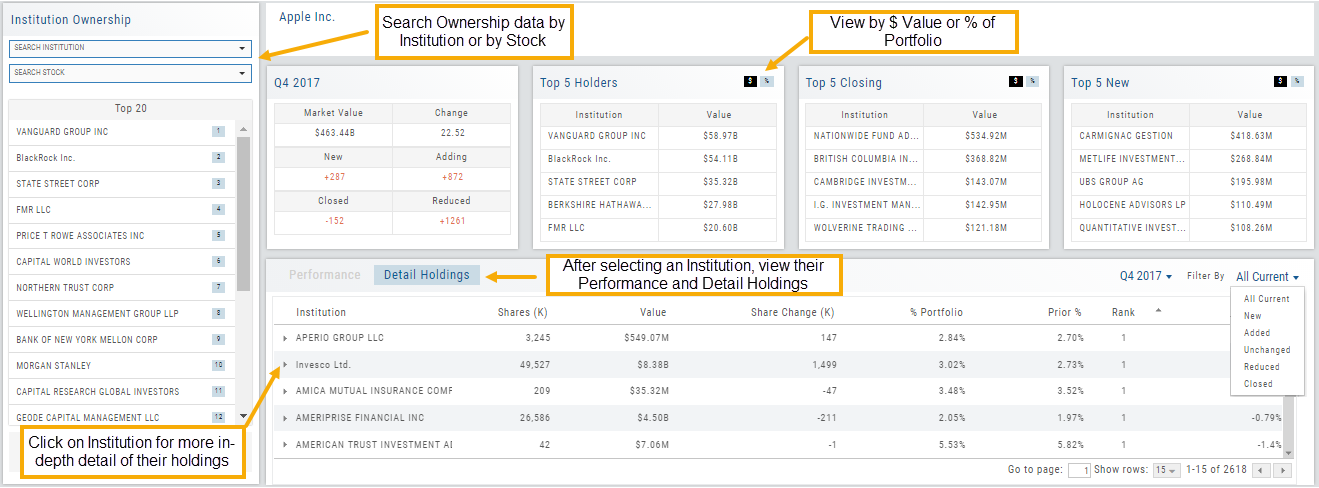
Clicking on “Detail” provides information on the last 20 Quarters. The information is layered allowing you to research ownership data further by Institution or Stock. You can further filter the ownership by those who added, reduced, dropped, unchanged etc. View holdings as a $ value or as a % of the Institutions’ portfolios.
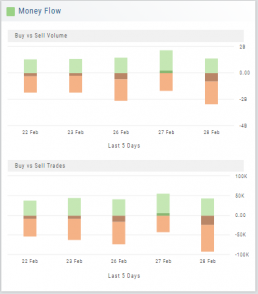
Inner Circle - Money Flow
Activity by Volume & Number of Trades
Money Flow shows trading activity in two views.
The darker shade in the middle of each column – either dark green or red- indicates difference
between the buy/sell volume and buy/sell number of trades.
For example, on February 27th, the top graph shows approx. 1.75 Billion
buying volume from just over 50k trades (bottom graph). Selling volume of
approx 1.5 B resulted from less than 50k trades.
Where the volume and trade columns overlap is an indication of
‘big money’ (Institutions) moving in(dark green)or out (dark red)
of the stock.
Note the dark green line overlap on both graphs for the Feb. 27th example.