Zoom Feature
Activate the Zoom Feature on the Chart by clicking on the Icon as shown:
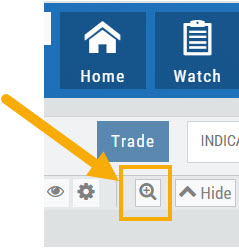
The icon will darken when activated – or, depending on your theme, may show up brighter: ![]()
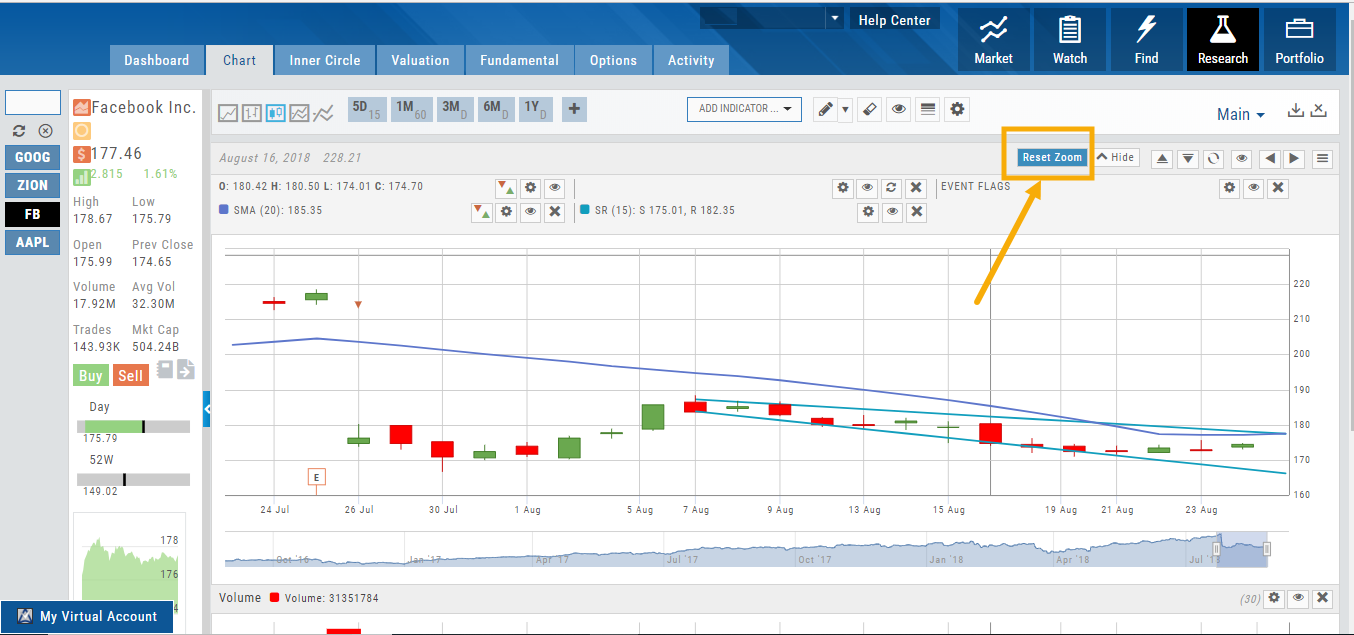
You can then “Click/Drag” your cursor.
A “Reset Zoom” button will automatically appear on the new display. When you are finished with your studies, simply click the same icon to restore the original time-period setting.
Trend Lines, Notes & Shapes and Advanced Annotations
Customize your charts with Trend Lines, Notes and Advanced Annotations.
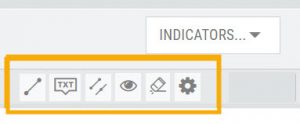 These tool icons are available above the chart, just below the Indicators drop-down box.
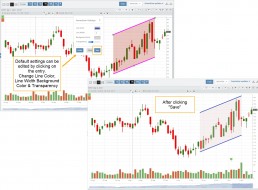
Each Annotation can have a Default Setting. This means all initially created lines, for example, will have the same settings, such as color and thickness.
Select your Annotation.
Draw it on the chart.
Click to display the dialog setting.
Adjust settings, then click “Save as Default.”
“Reset” will revert to initial settings.
You can still customize individual lines by saving the settings instead of saving as Default.
Fibonacci Too!
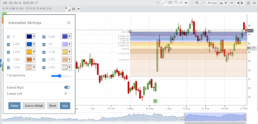
The Fibonacci Annotation has been enhanced to allow you to select which Retracement Levels you want to view, in addition to adjusting the color for each and the overall transparency.
The settings can be set as the Default for new chart entries or customize each entry, then “Save”.
**Please note: Existing Fibonacci annotations cannot be edited with this new coding. They must be deleted, then added back.
In addition, individual retracements can be extended Right and/or Left. Click the annotation on the chart to open the dialog box.
Note: The Extend Right/Left option cannot be set as a default setting.
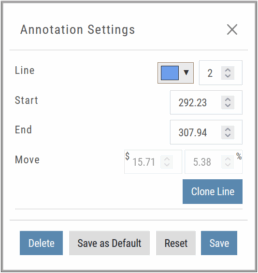
Clicking on any Trend Line, Note, or Advanced Annotation, will display the “Annotation Settings” box for that entry.
The Annotation Settings box can be repositioned elsewhere on the platform, if needed.
Line Color, Line Width and if applicable, Background Color and Transparency can be changed.
Be sure to click ‘Save’!
Note: Parallel channels are initially drawn horizontally. To change orientation click on the annotation then grab one of the ‘edit dots’ to drag to the position you wish.
Then click “Save” on the dialog box.
Crossover Arrows
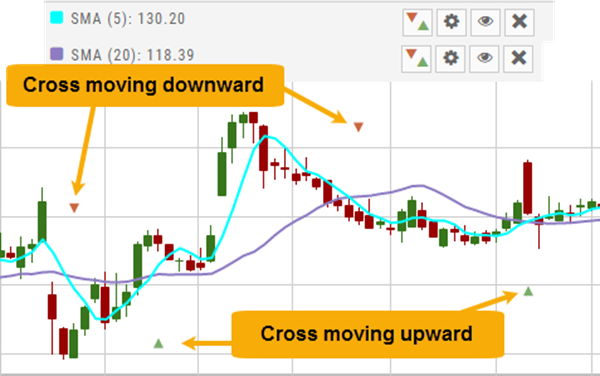
The Crossover Arrows ![]() identify the crossover points on indicators.
identify the crossover points on indicators.
For upper indicators, you can select 2 indicators and the chart will show the crossover arrow.
Example: If you select the 5 day and 20 day SMA the Green arrows will show the 5/20 crossover points when in an upward movement, Red for downward.
Only 2 moving averages can be selected at a time when utilizing this tool. If you wish to make a change to another moving average indicator, one must first be deselected before adding the new indicator.
indication
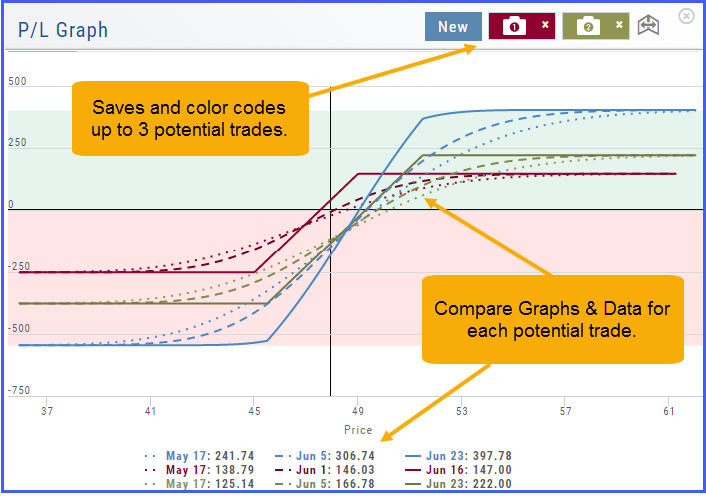
Profit/Loss Graphs
Any position entered in the Options Chain (Calls+Puts, Calls or Puts) will automatically display a profit/loss risk graph. The P/L Graph shows the Trade Profile Performance from the current day.
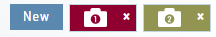
You can compare up to three (3) positions on one graph by utilizing the Camera Icons. Once you complete one trade scenario, click the first camera then click ‘New’. Structure your second trade scenario, click on the second camera. To add a third scenario, click new to structure an additional trade. The graphs will overlay.
Use SNAP to Backtest Positions
The Snapshot feature is also available with Backtesting.
- Click ‘Backtest’ on the Option Table
- Set up position
- Click one of the camera icons:
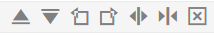
- Repeat the first step using the Rolling Icons to adjust the initial position to a new scenario:
- Click the 2nd camera icon & repeat the above steps for the last comparison.
- Select the ‘Analyze Date’ using the Date Picker (Calendar) or “EXP” to analyze the position on Expiration Date.


Trading from Options Page & Strategy Templates
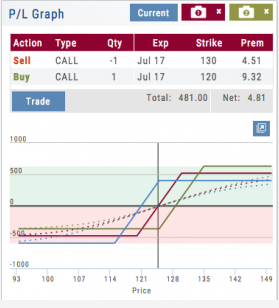
Structure and analyze any options position. When ready, click “Trade” to create and submit an Order Ticket.
Comparing trades with Snap? ![]()
Simply choose the structure you want then select “Trade” to send it to the Order Ticket.
Trading multi-leg positions is easier than ever!
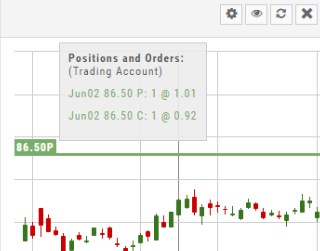
Working Orders Displayed on Chart
Charts display working orders and existing positions of selected brokerage accounts, currently Choice Trade and TD Ameritrade. More brokerages will be forthcoming.
- Stocks show a horizontal line at the entry price.
- Options show a horizontal line at the strike price.
- Green for Long and Red for Short.
The group of 4 icons, located above the Working Order, allow you to Edit (Gear), Hide(Eye) Refresh (Circle arrows) or Remove (X).
![]()
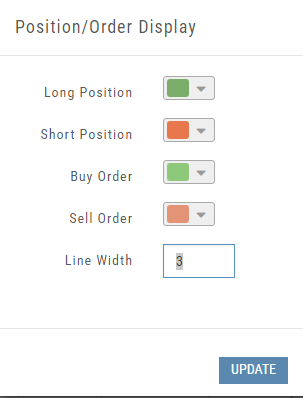
Display choices including colors and line width are available in settings by clicking the “Gear” Icon.
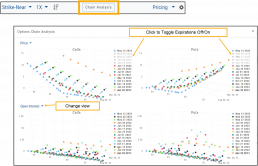
Options Chain Analysis
The Option Chain pages offers a 3-D analysis comparing expiration dates by selected criteria.
Click on “Chain Analysis” to display the graph.
Use the drop-down boxes to view the tables by Implied Volatility, Volume, Open Interest, Price, Extrinsic Value, Delta or Intrinsic Value.
Toggle the view by using the clickable legend to select the Expiration Dates to view.