26-06 Release- Bid/Ask Percent Data
Bid/Ask Spread – Premium Percentage
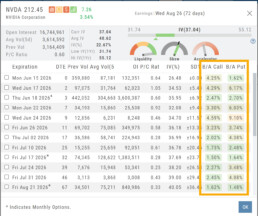
What do these columns represent?
The values represent the Bid/Ask spread percentage for the At-The-Money strike for each Expiration.
The percentage background color ranges from green, gray, yellow, and red, which represents the most liquidity to least for that ATM Expiration
Spread Trade example:
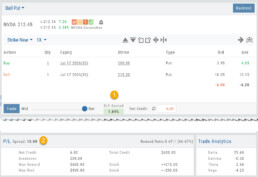
Bull Put
1. The negotiation slider dynamically calculates the percentage of the position premium (debit or credit) that the bid/ask spread comprises when the slider is moved between the Mid (0.00%) and Natural (Max %).
2. This value confirms the Spread value. In this example, the value is 15. The strikes are 200/215:
Multi-Leg Example:
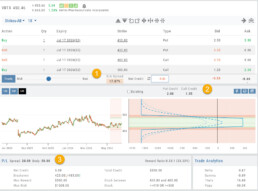
Iron Condor
1. The negotiation slider dynamically calculates the percentage of the position premium (debit or credit) that the bid/ask spread comprises when the slider is moved between the Mid (0.00%) and Natural (Max %).
2. The Put/Call Premium is calculated and tied to the “Bid”.
3. The Outer legs and Body spread values.
Change Log
- ADUR display resolved
- Repaired snap quote issue with Tradier
- SPLG>SPYM display data corrected
26-06 Release Notes: Bid/Ask data
Bid/Ask Spread – Premium Percentage
What do these columns represent?
The values represent the Bid/Ask spread percentage for the At-The-Money strike for each Expiration.
The percentage background color ranges from green, gray, yellow, and red, which represents the most liquidity to least for that ATM Expiration
Change Log
- ADUR display resolved
- Repaired snap quote issue with Tradier
- SPLG>SPYM display issue corrected
26-03 Release Notes: Journal Auto-Reconcile, Extended Trading, New Charting Indicators
Platform Release Summary
This release helps you see more of the market, spend less time tracking trades, and apply your strategies with greater confidence—with extended-hours charting, automated journal reconciliation, and new technical indicators.
Journal Auto-Reconcile
The auto-reconciliation in the Trade Journal aligns trades and results—allowing users to focus on analyzing performance instead of managing data. Since consistent review is key to improving as a trader, this feature makes the process significantly easier and more accurate
Start in the Reconcile View of the Journal:
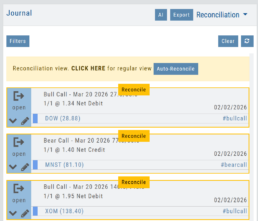
Next, click the ![]() button.
button.
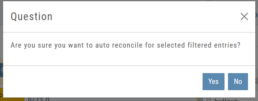
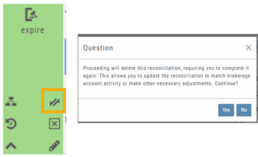
The dialog box to the left will appear:
Click “Yes”
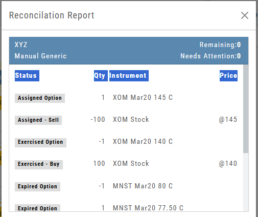
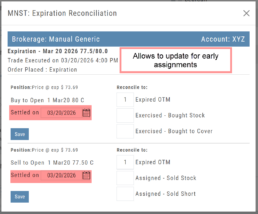
The display will list the resulting action for each expiration.
You can scroll to review.
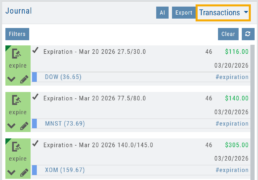
The Reconcile view will clear and all Journal Tabs will update to reflect the action resulting from each Expiration.
The arrow icon (shown) allows editing – including early assignment of options.
Note: This icon will *only* appear on Journal Tabs where the function is permitted.
Example: Stock Positions will not display the icon.
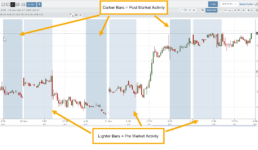
Extended Trading Hours
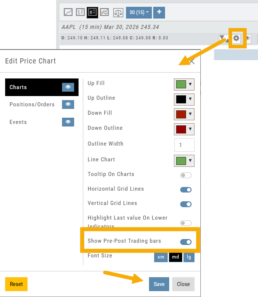
Pre and Post-Market activity can be displayed on Intra-Day charts:
First, click on the Gear icon as shown.
Then, toggle “Show Pre-Post Trading bars” to the On position, as shown.
Finally, “Save“.
Additions: New Charting Indicators
Chande Momentum Indicator (CMO)
Measures the strength of price movement by evaluating both gains and losses, providing a more balanced view than traditional oscillators.
- Above +50: Indicates overbought conditions (potential selling opportunity)
- Below -50: Indicates oversold conditions (potential buying opportunity)
Summary: Helps identify when price movement may be overextended and due for a reversal.
Chaikin Money Flow (CMF)
An oscillator measuring buying and selling pressure by analyzing money flow volume over a set period, rather than cumulatively.
- Positive values: Indicate buying pressure (accumulation)
- Negative values: Indicate selling pressure (distribution)
- Default setting: 20-period (typically 20 days)
Summary: Helps identify whether money is flowing into or out of a security over a defined timeframe.
Directional Movement Index (DMI)
A trend indicator that measures both the direction and strength of a trend using three lines: ADX, +DI, and -DI.
- +DI above -DI: Indicates an uptrend
- -DI above +DI: Indicates a downtrend
- ADX: Measures trend strength (regardless of direction)
- Default setting: 14-period
Summary: Helps identify trend direction and the trend’s strength
Ultimate Oscillator
A momentum indicator that combines three timeframes to provide a more balanced view of market strength and reduce false signals.
- Higher values: Indicate stronger buying pressure
- Lower values: Indicate stronger selling pressure
- Used to identify overbought/oversold conditions and potential trend reversals
Summary: Helps confirm momentum and spot potential turning points with greater reliability.
Change Log
- Improve OHLC appearance
- Repair drawing annotations on extended chart
- Reconciliation mode functionality fixed
26-01 Release Notes: Bracket Order Adjustment, Journal Reports, Show Confirmation
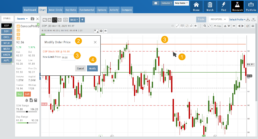
Adjust Limit and/or Stop Orders from the Chart
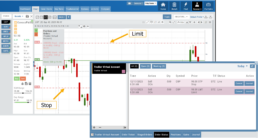
- Click on the Limit (or Stop) Order Dashed Line
- The Modify Order Price dialog box will appear
- Either move the dashed line to the new position, this will temporarily show up as a solid line. OR enter the new price in the dialog box.
- Click Modify
Once modified, the Limit order becomes a dashed line at the updated price.

Journal Reports
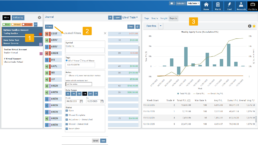
Journal Reports transform your trading data into visual insights that highlight performance trends, behaviors, and outcomes at a glance. With intuitive charts and summaries, you can easily evaluate results, refine strategies, and build more consistent trading habits.
Show Order Status (Go to Order Ticket)
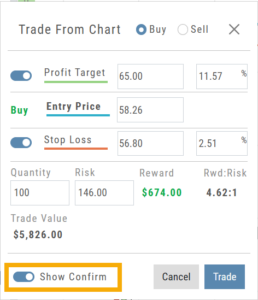
When trading from the Chart (OCO orders), you can elect to Show Confirmation – or not.
Toggling “On” will take you to the Order Ticket to review and submit your Order to the supporting brokerage.
The Order Ticket tab allows you to further adjust and even Stage the Order.
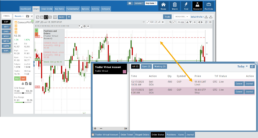
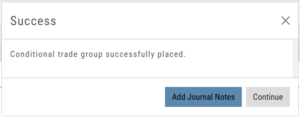
Once reviewed and submitted, you’ll get a confirmation the order was submitted, as shown here:
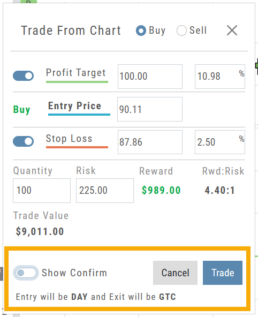
Toggling “Show Confirm” to Off, will bypass the Order Ticket window and convert the “Trade from the Charts” action to an Order Ticket itself.
Notice: The Entry is a Day Order, the Exit is a GTC order
Clicking “Submit” will send the order directly to the supporting brokerage.
Since the Order Ticket is bypassed, additional adjustments or Staging is not permitted when “Show Confirm” is in the “off” position.
Once submitted, as with “Show Confirm” activated, you’ll see this notice:
Platform Features Release: Additional Features/Adjustments to Streamline Functionality
Announcing the latest Release of feature and functionality additions and enhancements to the trading platform to streamline/improve functionality.
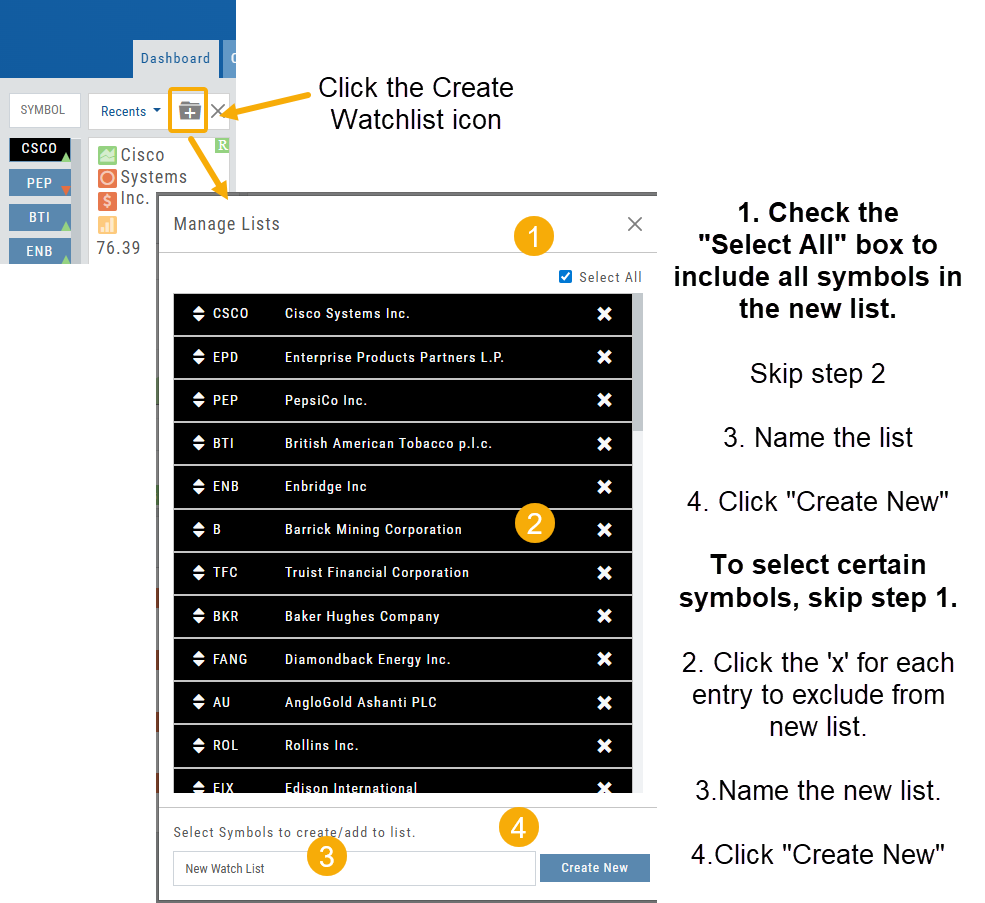
Build a Watch List from “Recent” List
Build a new Watchlist directly from the “Recent” list in Research.
Navigation Bar
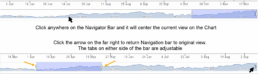
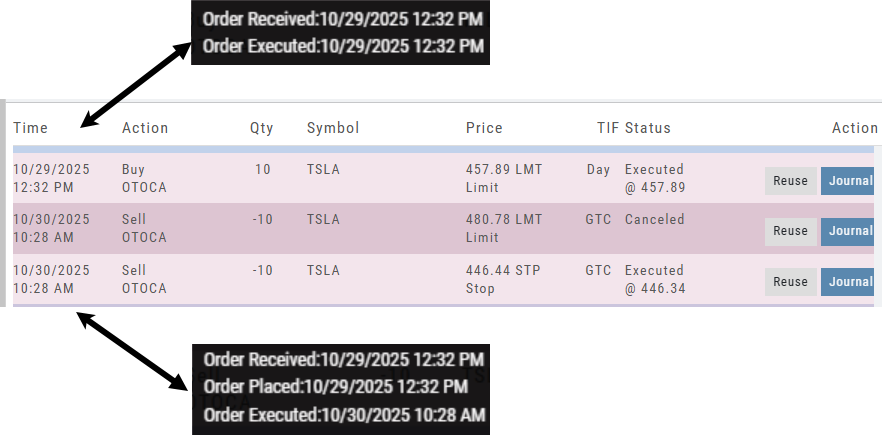
Order Status Time Stamp
Hover your cursor over the Order’s Date/Time info to display the Order’s activity Time Stamp.
Other Additions
- Enter a symbol, and it will appear in the symbol box. This works on any of the Research tabs.
- Adding a symbol when Creating a new Watchlist automatically adds to the list. The “Add” button has been removed.
Change Log
- Corrected “Close” action from Staged Trade
- Trailing % display corrected
- Renamed tooltip from “Add Watchlist” to “Create/Delete” vs. “Add/Delete”
Platform Features Release: Sandbox Trading Account, Order Status Filter & more
Announcing the latest Release of feature and functionality additions and enhancements to the trading platform to assist the investment/trading decision process.
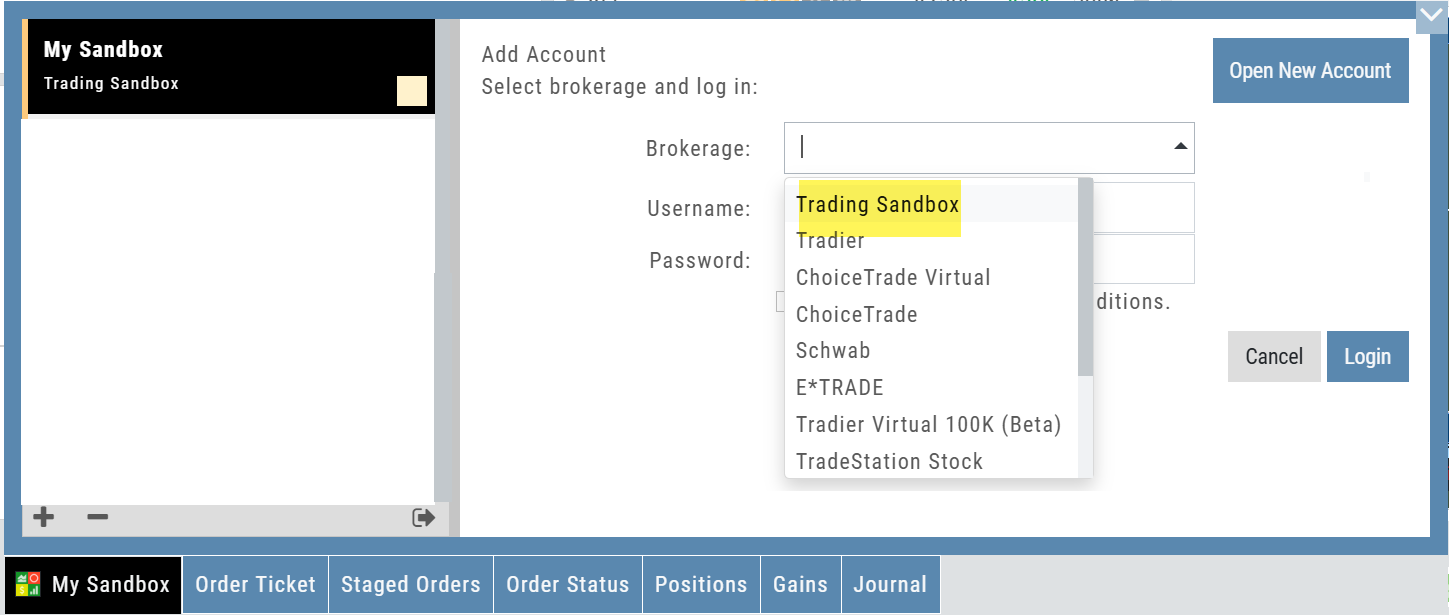
Trading Sandbox Virtual Account
Announcing a new Virtual Account with fast execution, accurate tracking, and reliability you can depend on.
Unlike traditional broker-provided virtual accounts, the Sandbox is not bound by brokerage margin rules or limitations, giving you more freedom to practice and test strategies.
The Sandbox uses delayed market data. In addition to fast, reliable trade execution and accurate trade capture, it also handles options correctly, supports Conditional Orders for stocks, full Journal Support, and more!
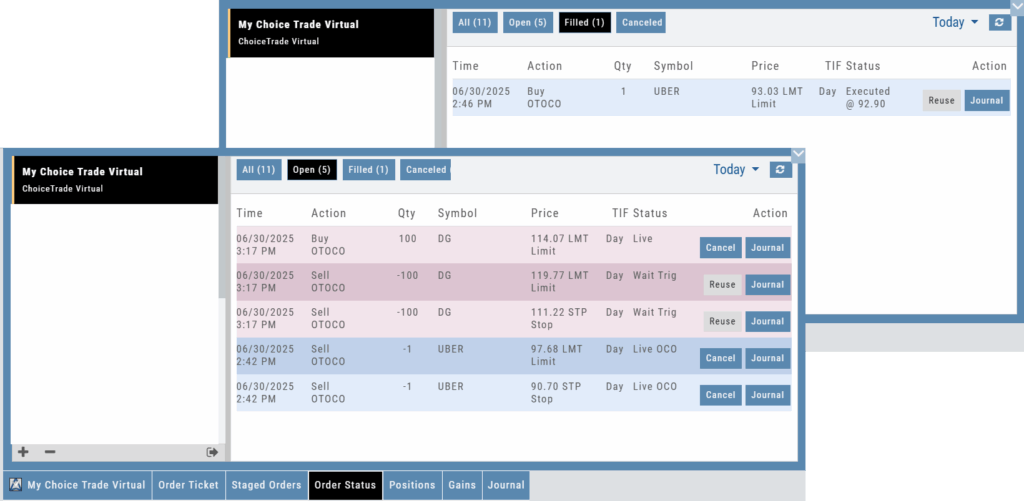
Order Status Filter Buttons
The Order Status Tab filter buttons make it easy to locate previous orders
![]()
- All – Everything in the time period is shown on the tab (Today, 1 Week, 1 Month, etc.).
- Open- Orders that have not yet executed as an active Trade/Position – includes Waiting Conditional orders.
- Working – Bracket orders where the underlying stock order is an active position (Stop/Limit orders). Excludes Waiting Conditional orders.
- Filled – Executed orders whether to open/modify/close
- Canceled – Includes both manually canceled as well as day orders that did not get filled prior to the end of the Market Day
OCO Journal Tagging
OCO Orders are automatically tagged in the Journal.
Once the Stock Order is Executed (it is an active Position), the Limit and Stop orders are Live (active Orders for the duration selected: Day or GTC.)
If/when the stock hits the Limit price, that order will execute, and the Stop order will be canceled. The Journal tab will be green and display a Gain/Profit.
-OR-
If/when the stock hits the Stop price, that order will execute and the Limit order will be canceled. The Journal tab will be red and display a Loss.
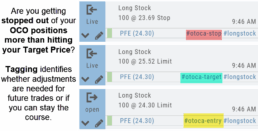
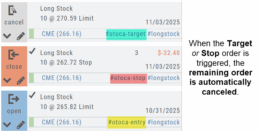
**Note: Past Conditional trades will be tagged as “otoca-entry”, “otoca-target” and “otoca-stop”.
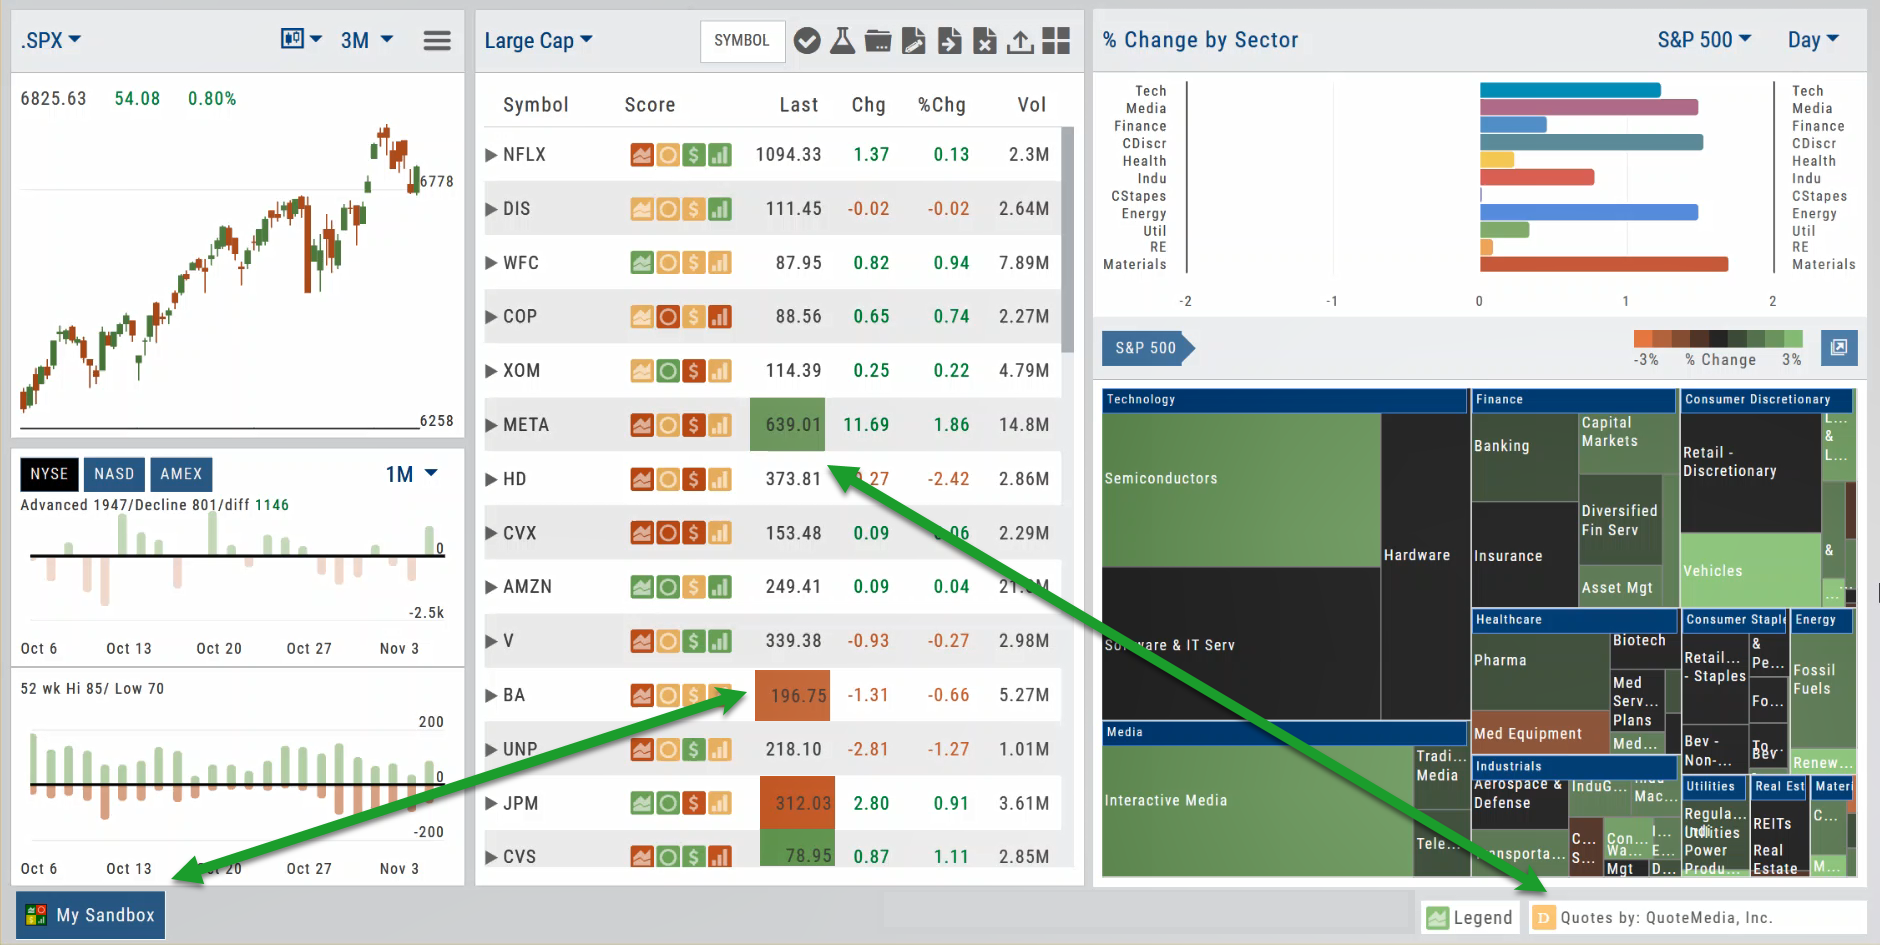
Delayed Streaming Quotes
Delayed Streaming Quotes will appear when you have a Virtual or Manual Account activated.
Click on the account tab so that it appears on the bottom left corner of your screen.
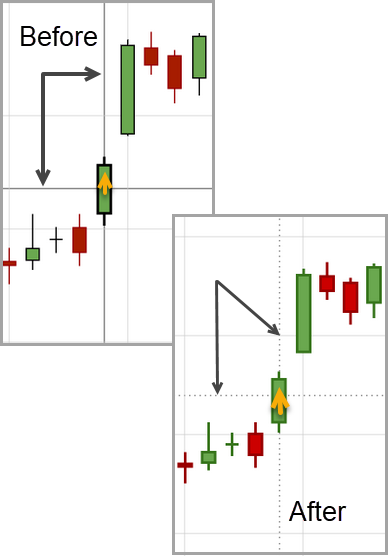
Extend Fibonacci Retracements on Charts
Fibonacci retracements can be extended right and/or left on the chart.
Click an existing Fibonacci annotation, then use the toggle switches to adjust it.
Don’t forget to “Save”
Note: Extend Right/Left can be edited/saved individually, not Set As Default.
Chart crosshairs
The cursor crosshairs on the chart have been adjusted so they no longer obscure the candlestick wicks
Other Additions
- Set “GTC” as default duration for Exit Order on Trade Ticket
- Modify TTM Squeeze formula to follow industry
- Auto-select Option Cycles for existing Order(s)
Change Log
- Resolved Screener glitch to move candidates to selected watch list
Platform Features Release: New Zoom Functionality, Chart Panning
Announcing the latest Release of feature and functionality additions and enhancements to the trading platform to assist the investment/trading decision process.
New Zoom Functionality
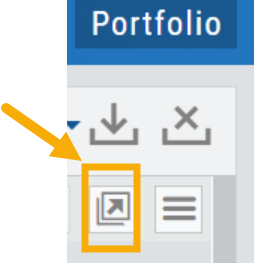
To activate Zoom, click on the Zoom button has been added to the icon toolbar:
![]()
- Once activated, the button changes color.
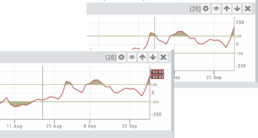
- Click/drag the mouse/cursor over the area of study.
- A “Reset Zoom” button will display when you want to restore the view.
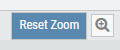
Chart Panning Functionality
Click/drag now pans the time period/price range on the chart – when dragging your mouse/cursor either right/left
Other Additions
- “Choppiness Index” Chart Lower Indictor added
- “Are You Sure You Want To Cancel This Order?” added on Order Status tab
- Clicking on “Quotes By” box (lower right corner) will display source of quotes
Change Log
- Reuse .XSP and .SPX order functionality restored
- Trading Block OTM trade error fixed
- Schwab recognizes BRK.B now
- Resolved Liquidity Range in Screener
Platform Features Release: Alert and Chart Feature Enhancements
Announcing the latest Release of Charting and Alert enhancements.
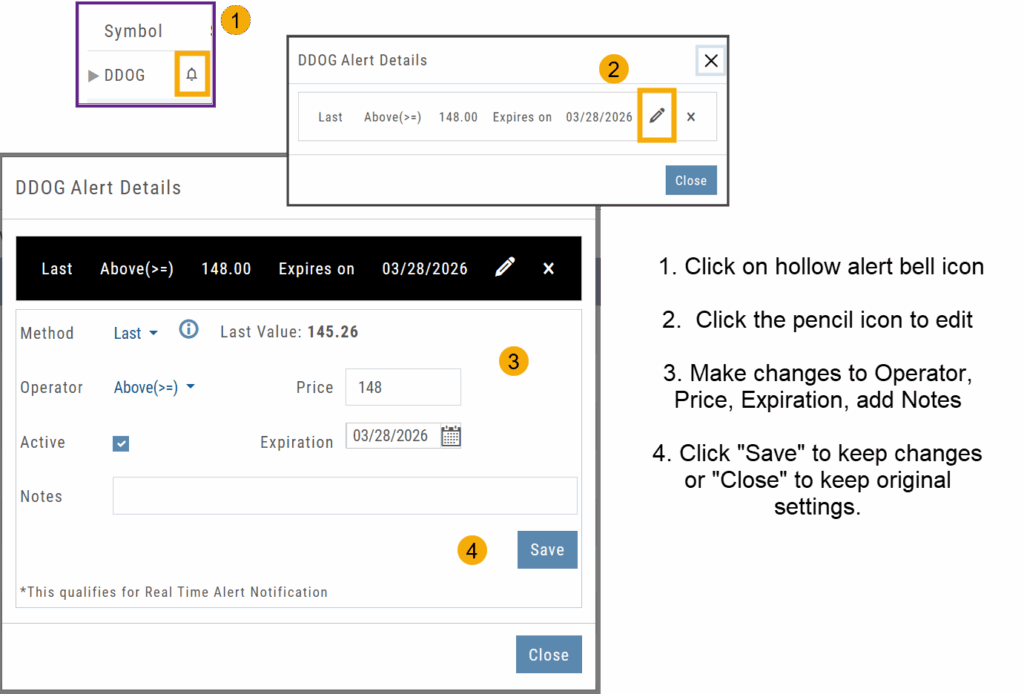
Edit Alerts from any Accessible Screen
Price Info added to Go Big Chart View
Last, Bid, and Ask values have been added to the Big Chart window, with Trade capability
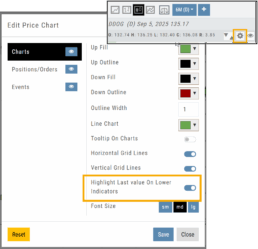
Price Chart Control
Toggle switch on/off to show/hide last value of certain lower indicators.
Change Log
- Price Slices bug fix
- Brokerages to set Virtual Account Limits
Platform Features Release: Annotation Enhancements, Condor Trade Set Up
Announcing the latest Release of Annotation improvements and Strategy template adjustment. We’ve also made several practical changes for better access to features/functions.
Independent Default Settings for Annotations
When adding Annotations such as lines, rays, arrows, etc, to the chart, the settings for that type of annotation can be set as a “Default”. Line settings are independent of other annotations’ settings.
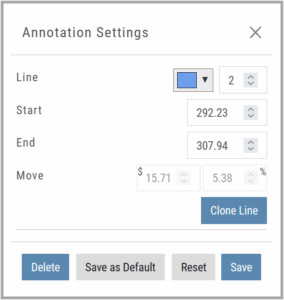
Add the Annotation.
Click on the annotation to display the Dialog box (shown).
Make any adjustments.
Click “Save as Default”
The newly added and future annotations of the same type will have the new settings.
Click “Reset” to revert to original settings.
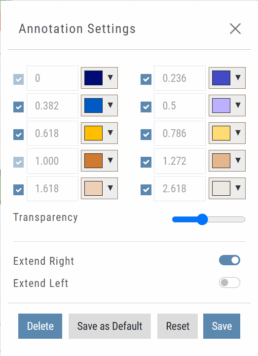
Fibonacci Too!
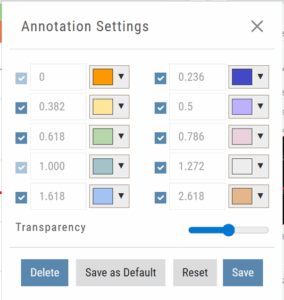 The Fibonacci Annotation has been enhanced to allow you to select which Retracement Levels you want to view in addition to adjusting the color for each as well as transparency overall.
The settings can be set as the Default for new chart entries.
**Please note: Existing Fibonacci annotations cannot be edited with this new coding. They must be deleted, then added back.
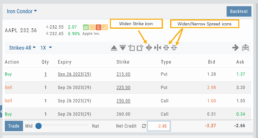
Condor Strategy Template Adjustment
The core functionality of Condor Strategy Templates has been adjusted. (Iron/Long/Short)
The center strikes are now anchored by default and will only change if you adjust them manually on the template itself or by using the “Widen Strike” icon —making trade construction more intuitive and consistent.
Widening/Narrowing of the center Strikes will change the spread of the Condor, which can be done manually on the template or by using the “Widen” or “Narrow Spread” icon.
Other Additions
- EOD lower Indicators will display “Chart Unavailable for intraday charts.”
- Zoom feature now includes a double-click “on-off” functionality
- HeatMap legend (Find>HeatMap) is movable
Change Log
- Heatmap legend is no longer fixed when clicked to view
- Transparency for shapes is resolved
- Price slice functionality adjusted for price changes
- Zoom feature is now toggle functionality
- Scrolling chart/arrow functionality resolved
Platform Features Release: Set Alert from Option Tab
This Release focused on fixes and set-ups for future capabilities and added the following:
Setting Alerts Enabled from the Option Tab in Research.
Bracket Order capability in ChoiceTrade Virtual Accounts
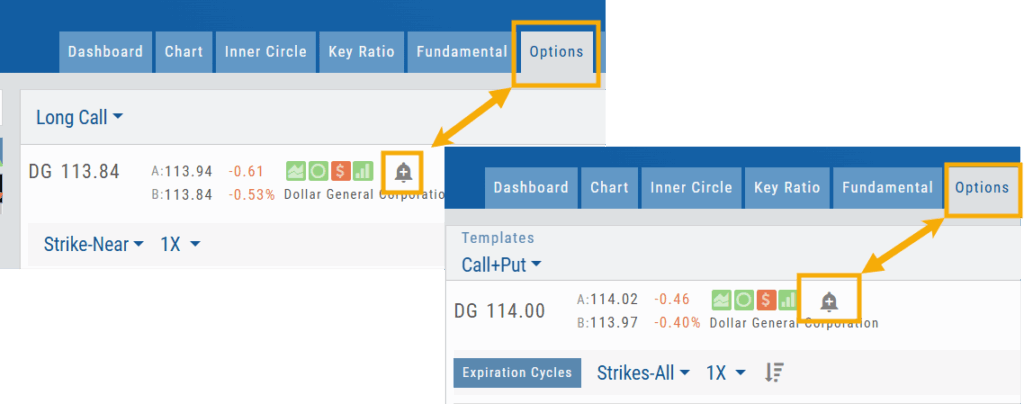
Set Alerts from Option Tab
Alerts can be set from the Option Tab – as, in Research, this was the only tab where the Info box on the left side of the screen was not visible.
ChoiceTrade has Bracket Order capability
ChoiceTrade supports Bracket Orders on Stock.
Change Log
- Resolved “Reset Zoom” function on chart vertical expansion
- Alert Expiration is midnight of Expiration day
- Mobile App Account highlight function corrected
- Chart Period selection – activation area increased