Platform Features Release: New Chart Periods, Mobile App Updates, Order Status Message
This Release includes Mobile App enhancements with some important upgrades, New Chart periods added and important Order Status messages.
Fundamental Data: This tab greatly expands the amount of data provided, mirroring what is displayed on the desktop browser version
Faster response time: Technological updates enable the app to perform actions more quickly.
Alert Functionality on Mobile App: Upon enabling Notification functionality on your devices, you will receive alert notifications on your mobile device, even when not logged into the platform!
One, Two & Four-Hour Chart Views – New periods allow for more technical analysis.
Order Status Message – The status provides feedback if an order is rejected.
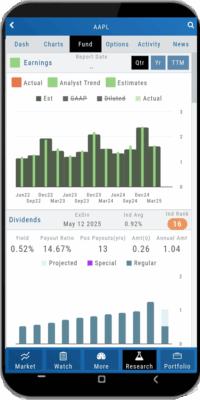
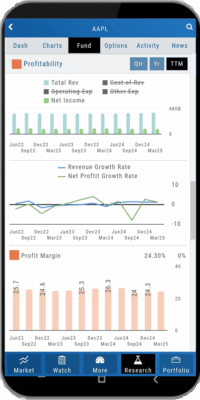
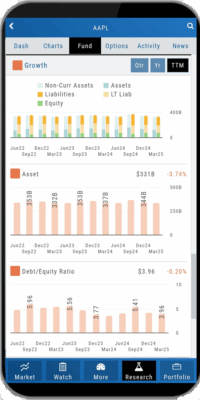
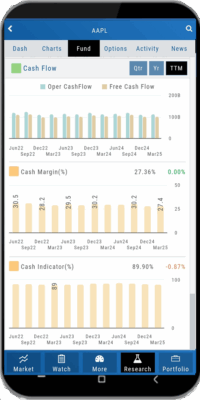
Mobile App – Fundamentals
The Fundamentals Tab allows you to scroll to see the same datapoints as on the desktop version. This includes the ability to select, where applicable, The last Quarter, Year or Trailing Twelve Months (TTM).
Toggle data displays by clicking on the individual datapoint in the legend for each section.
Enhanced Alert Functionality on Mobile
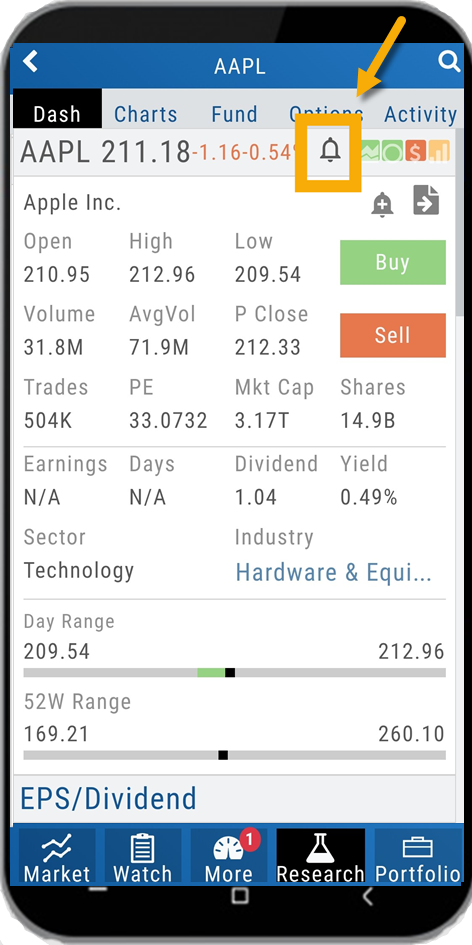
Enabling Alert notifications on your device will allow you to receive important updates – even when you aren’t logged into the app!
If you are logged in and such notifications are enabled, the notifications will appear as a pop-up on your desktop if you are logged into your platform or to your browser if you aren’t .
Alerts can be set up on Desktop (web and app) and the Mobile App.
Chart Periods
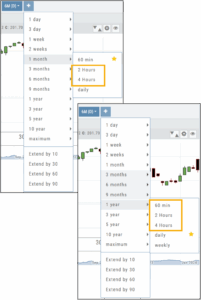
2-hour and 4-hour candlesticks have been added to the 1-Month Chart Period.
3-Months through 1-Year, inclusive, offer 1-hour, 2-hour, and 4-hour candlesticks for more in-depth chart analysis.
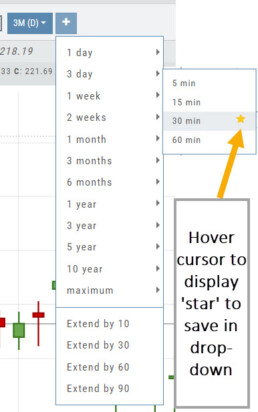
To add to the dro
p-down list of Chart Periods as a “Favorite”, hover your cursor to the right of the period selected for a sta
r to appear. Click.
To remove from the drop-down, click on the Star again.
Order Status Message
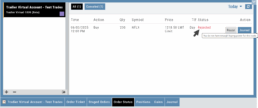
If an order gets rejected, the Status becomes a link that, when hovered over, displays the reason for the rejection.
For example, on a 100k Virtual Account, an order was submitted to buy 200 shares of a $1200 stock. It was rejected, and the message on the Order Status read:
![]()
Change Log
- Resolved “Erase All” behavior
- Reset Zoom function on Max W and M resolved
- Mobile App Account highlight function corrected
- Chart Period selection – activation area increased
Platform Features Release: New Zoom Functionality, Chart Panning
Announcing the latest Release of feature and functionality additions and enhancements to the trading platform to assist the investment/trading decision process.
New Zoom Functionality
To activate Zoom, click on the Zoom button has been added to the icon toolbar:
![]()
- Once activated, the button changes color.
- Click/drag the mouse/cursor over the area of study.
- A “Reset Zoom” button will display when you want to restore the view.
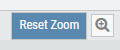
Chart Panning Functionality
Click/drag now pans the time period/price range on the chart – when dragging your mouse/cursor either right/left
Other Additions
- “Choppiness Index” Chart Lower Indictor added
- “Are You Sure You Want To Cancel This Order?” added on Order Status tab
- Clicking on “Quotes By” box (lower right corner) will display source of quotes
Change Log
- Reuse .XSP and .SPX order functionality restored
- Trading Block OTM trade error fixed
- Schwab recognizes BRK.B now
- Resolved Liquidity Range in Screener
Platform Features Release: Economic Dashboard, Chart Adjustment, Chart Time Period
Announcing the latest Release of feature and functionality enhancements to the trading platform to improve the investment/trading decision process.
Economic Dashboard: View chart data from dozens of economic reports. Includes information on why it is important, what to look for, and how to apply the data to trading.
Chart Adjustment: Ability to compress and expand y-axis.
Chart Periods: New look, improved functionality.
Economic Dashboard
Located under the Home/Market Tab, this powerful research tool provides important economic information in chart format.
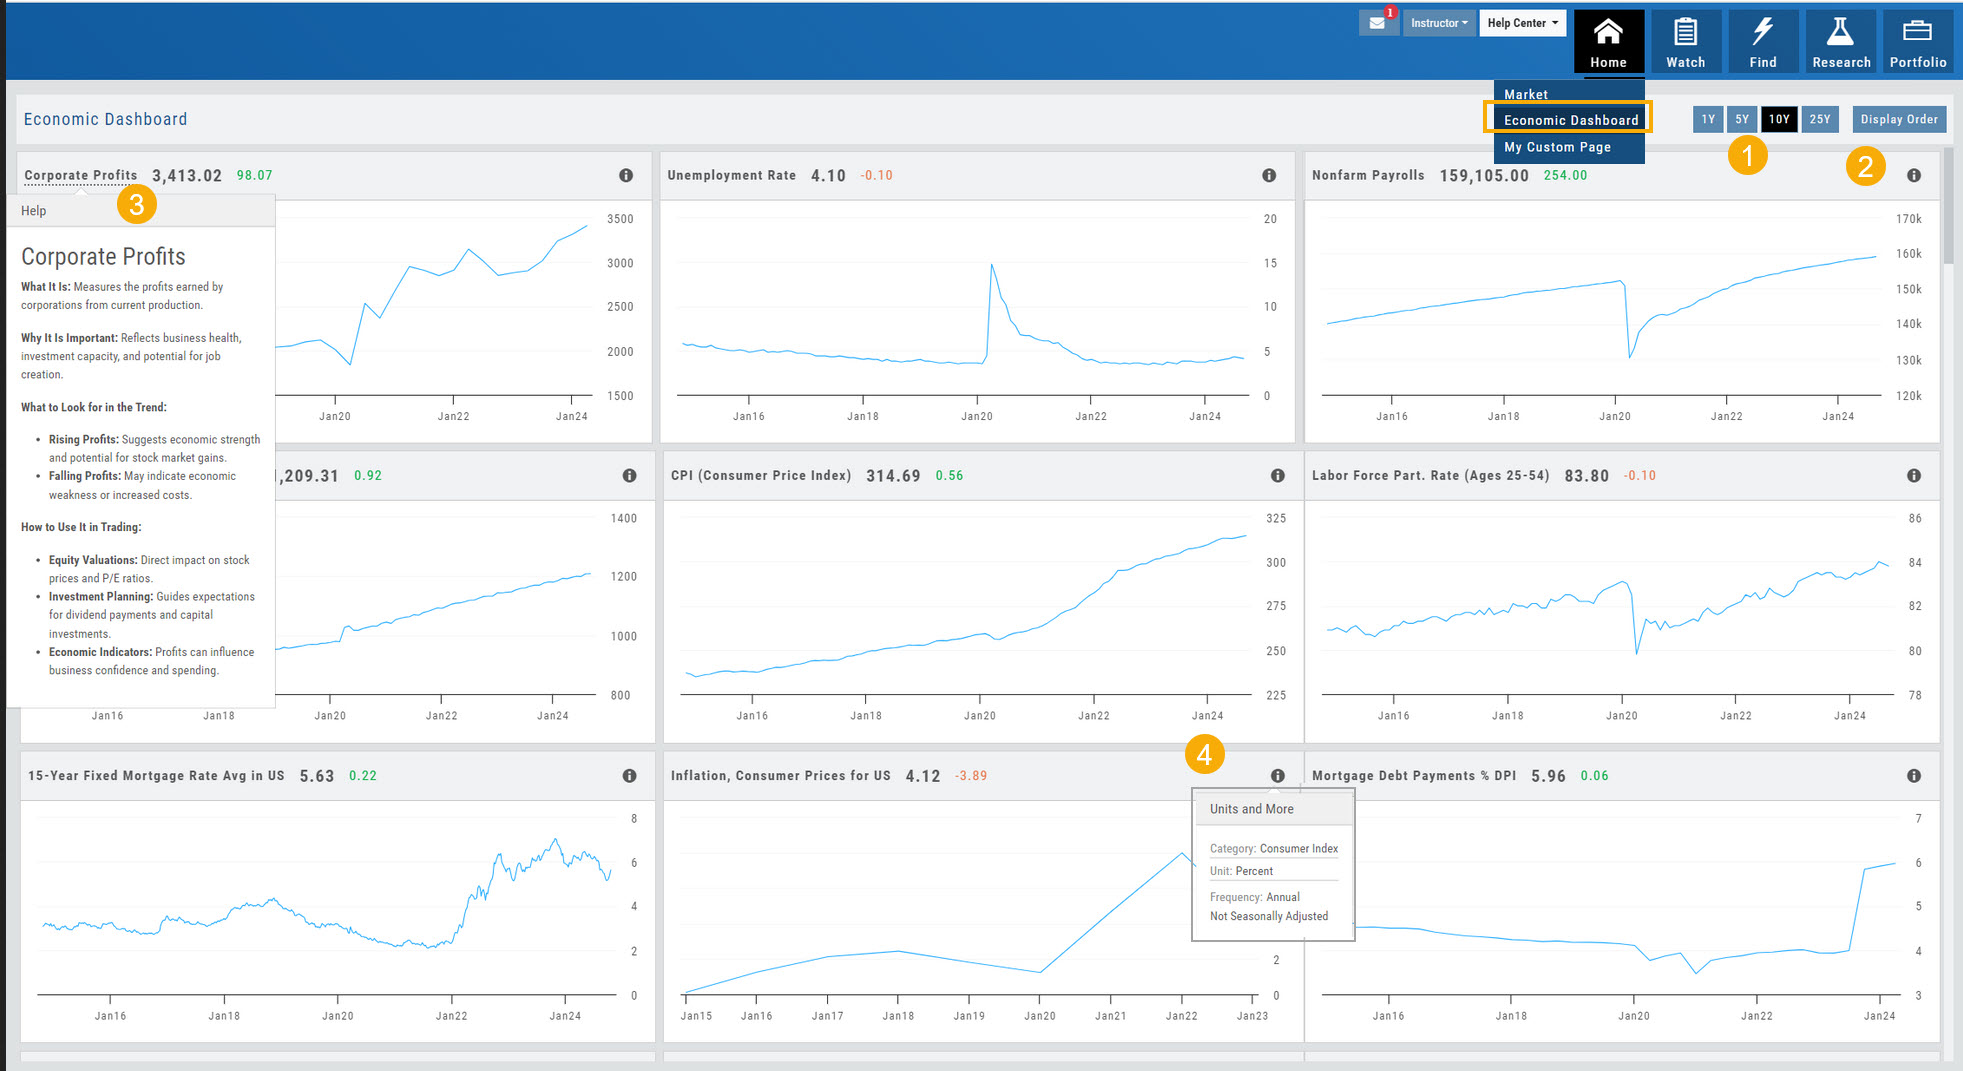
- Select from 1*, 5,10 or 25-year views
- Allows you to select display order as well as ‘hide’ charts.
- Click on the Title to display: What the data represents, Why it is important, What to look for and How to apply the data in trading
- Provides info on the Economic Report Category (Consumer), what the numbers represent (%, $, units, etc), how Frequent the data is reported (Quarterly, Annually, Monthly, etc)
* Some reports are released annually. 5, 10 or 25 year view are recommended in these instances.
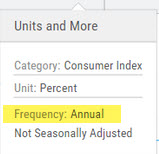
Chart Adjustment
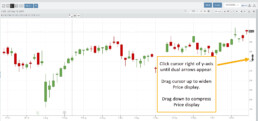
Adjusting the chart’s y-axis gives you more flexibility – whether it’s forecasting, adding notes, viewing current positions, etc.
Simply click you cursor to the right of the y-axis, then drag your mouse/cursor up or down.
To reset, click the ‘refresh’ icon ![]() on the chart toolbar
on the chart toolbar
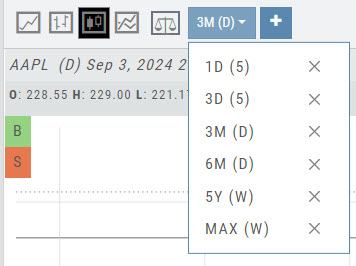
Chart Time Periods
The Chart Period format has been streamlined for a more streamlined look.
The current chart period will be displayed at the top of the ‘favorite’ (saved) drop-down list.
Change Log
- ‘x’ moved to left side of symbol list in Research Tab
- Key Ratio and Compare Views are session sticky
- Seasonal chart corrected to show Price
- Cancel/Reuse display on Credit orders corrected
- Stock data restored on Scan backtest
- Staged Order display on chart functionality corrected
- Schwab Order Ticket close orders corrected
- Trade Station added under “Open New Account”
- Reward/Risk more clearly marked on Trade from Chart
- 1 Day/1 Minute added to Custom Page charts
- Resolved Seasonality percent chart
- Corrected MACD histogram overlap
- 60-minute charts/Schwab conflict resolved
- P/L Insight Graph includes up-to-date data
- Tradier Live Account Ticket credit/debit correction
- Staged Orders/Current Orders display consistency restored
- Screener – Score resulting in 0 candidates resolved
Platform Features Release: Trade from the Chart, Price Slices, Reset Virtual Account Options
Announcing the latest Release of feature and functionality enhancements to the trading platform to improve the position evaluation process, trade submitting process as well as offer additional practice account settings:
Price Slices: Evaluate theoretical outcomes of option positions when using the Strategy Templates.
Trade from the Chart: Use the control box or lines on Chart to adjust the entry point, Target Price and/or Stop Price.
Reset Virtual Account – Add ‘funds’ to an existing account OR reset everything and start fresh. You decide.
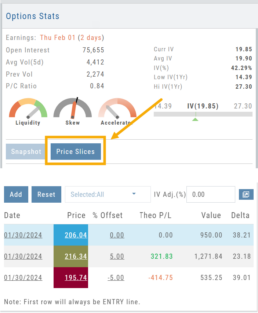
Price Slices (Premium Feature)
The ![]() Button appears on the right side of the screen when using the Strategy Templates.
Button appears on the right side of the screen when using the Strategy Templates.
Select one of the 22 Option Strategy Templates.
Build the position.
Click the Price Slices button to start your evaluation
Change the Date (default ‘today’), Price levels and/or % Offset
Add IV to view how this affects the theoretical P/L
Click the Go Big icon to view additional Greek data
Trade from the Chart
The ![]() button appears at the top of the chart for any symbol – whether there is an existing position or not.
button appears at the top of the chart for any symbol – whether there is an existing position or not.
Clicking this button activates an Order Window on the Chart, like this:
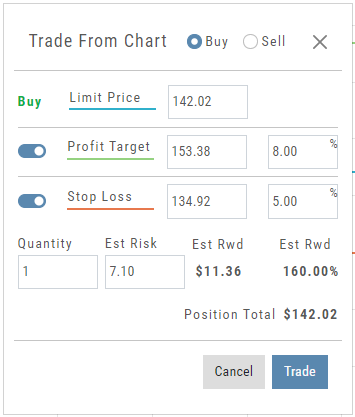
Note: Buy, Profit and Stop Loss line colors will match those displayed on the chart itself.
The values in the Order Window can be manually adjusted by $ or %
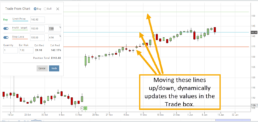
The values can also be dynamically adjusted by moving the corresponding line(s) on the Chart itself.
The Quantity value default is “1” to show the ‘per share’ dollar and percentage estimated risk, reward, as well as Position Total.
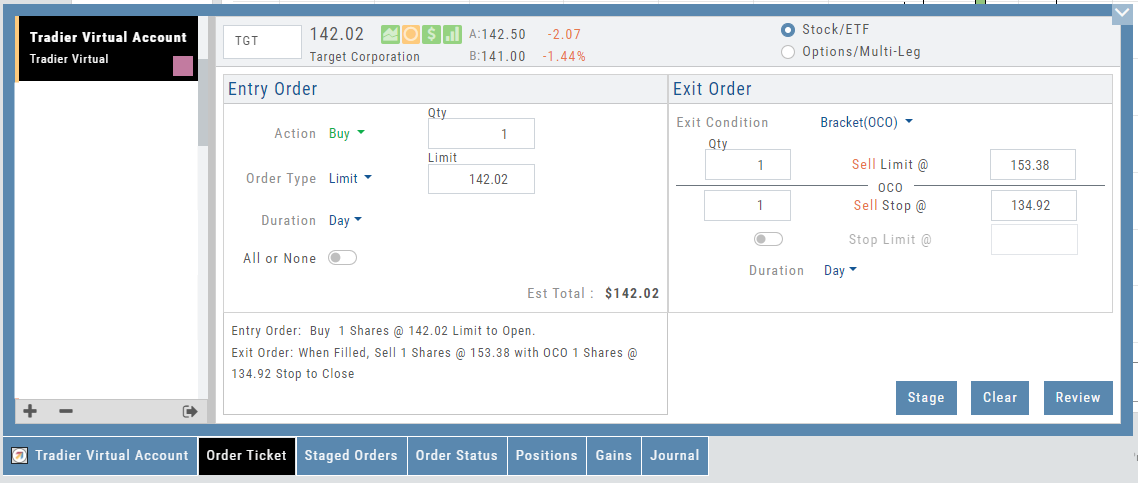
Click “Trade” for the prefilled Order Ticket to display.
The Order Ticket can be further adjusted, Staged or Reviewed to ensure it’s completed to your satisfaction, then Submitted.
Note: The brokerage selected must support Bracket Orders if the Stop/Stop Limit values are selected on the Order Window
Reset Tradier Virtual Account – 2 options
Tradier’s Virtual Account gives you the ability to add more “Cash” to your practice account – OR – completely start over:
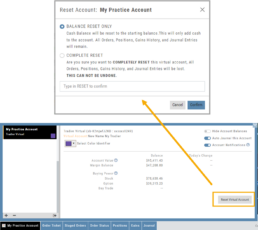
On the account summary page, click “Reset Virtual Account”
Select “Balance Reset Only” – to keep your existing trade activity, but add more “cash” to your virtual account.
Select “Complete Reset” – if you want to remove all prior transactions, including Journal Entries, Gains, Orders, Positions, etc. Note: This selection cannot be undone once it’s processed.
Type RESET in the box provided, then click the “Confirm” button
Enhancements
- ATM Option Strikes are bolded for easier identification
Change Log
- Adjusted theme contrast
- Corrected Order Type Limit price entry
- Snapshot functionality restored
Platform Features Release: Compare and AI capability added, Tradier Streaming
Join us Wednesday, October 25th for a special Office Hours session for an in-depth review session of the newest enhancements to your platform.
Announcing the latest Release of feature and functionality enhancements to the trading platform with the goal of improving the investment/trading decision process.
Research Tab/Dashboard:
Compare Tab: Provides an at-a-glance comparison of competitors of the same industry group with the ability to change symbols and Swing, Position, or Investor views (also “All” and “Default”)
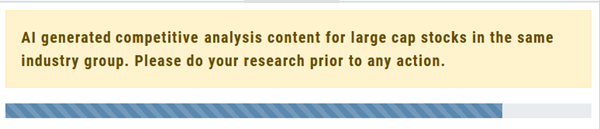
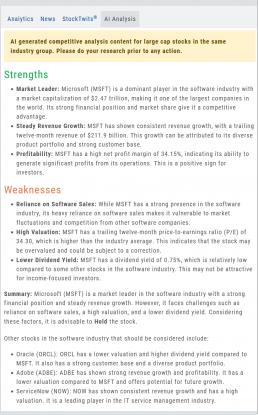
AI Analysis – AI generated competitive analysis for Large-cap stocks in the same industry group.
Compare Tab
The Compare feature, found under the Research Tab, allows investors to review a particular stock against its industry peers. Different Views offer Investors perspectives with different investment strategies, such as value or growth investing, to identify stocks that align with their preferred strategies within a specific industry.
Some of the Compare benefits include:
- Relative Valuation: Ratios like price-to-earnings (P/E), price-to-sales (P/S), or price-to-book (P/B) can be assessed whether a stock is overvalued or undervalued relative to its peers.
- Identifying Outliers: If a company has significantly different ratios compared to its peers, it may warrant further investigation to reveal potential investment opportunities or risks.
- Industry Trends: Analyzing ratios across an industry can reveal trends and patterns. For example, if the majority of companies in an industry experience a declining profit margin, it may indicate a broader industry challenge or trend.
- Risk Assessment: Comparing key ratios can help assess the financial health and risk profile in an industry context. Companies with lower debt-to-equity ratios, for instance, may be considered less risky, especially if this trend holds across the industry.
- Operational Efficiency: Comparing Ratios like return on equity (ROE) and return on assets (ROA) among industry peers can provide insights into a company’s operational efficiency.
NOTE:
While comparing key ratios within an industry offers valuable insights, it’s VITAL to consider other factors , such as the company’s business model, competitive advantages, management quality, macroeconomic conditions, etc. Ratios should be only part of a broader analysis to make well-informed investment decisions.
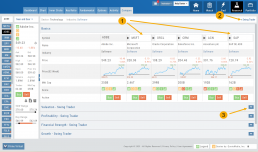
The fields automatically populate with industry peers. They can be changed to compare other symbols of your choice.
AI Analysis
Located within the Activity Tab in Research, Stock AI analysis has the potential to enhance and streamline the process of evaluating and trading stocks in the financial markets.
Stock AI analysis can quickly process and analyze vast amounts of financial data, news, and market sentiment in real-time. This enables investors and traders to make more informed decisions based on a comprehensive view of the market.
Click on the AI Analysis Tab for the current symbol you are viewing. A progress bar will appear while the information loads for the initial session view only. The information will remain even if you log out and back in again during the same Market Day.
It’s important to note:
While Stock AI analysis offers these benefits, it also comes with challenges and risks, such as overreliance on algorithms, potential biases in data, and the need for continuous monitoring and oversight. Investors and traders should use AI analysis as a tool to complement their decision-making process rather than relying solely on it.
Streaming Quotes with Tradier
Your Tradier Account offers Real-Time Streaming Quotes!
Simply log in to your Tradier account from the platform, and you’ll see the Real-Time quote updates without having to change screens or refresh your browser!

Change Log
- At-the-Money Strike price bolded on Templates
- Long Butterfly template error corrected
- Resolved slider bar/template editing functioning
- Event flag display function preserved
- Slider bar function corrected on template page
Platform Features Release: July 2023
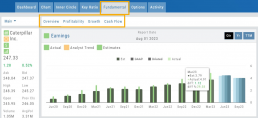
Announcing the latest Release of feature and functionality enhancements to the trading platform with the goal of improving the investment/trading decision process. These two areas of the platform have undergone a major redesign and expansion of metrics.
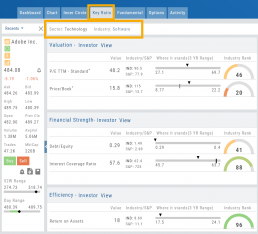
Key Ratio Tab(formerly Valuation)- Reworked and expanded data points offered as well as provided context of how well a stock is performing compared to its Industry and the S&P.
Fundamental Tab – Improved display of the expanded data available offer the ability to view fundamental metrics by Quarter, Year or Trailing Twelve Months (TTM) with the ability to adjust the time period and data display views.
Register for Office Hours, Wednesday, July 12th
Join us for a special Office Hours session, Wednesday, July 12th at 4:15 Eastern (15 minutes after Market Close)
Rance will be showcasing the Key Ratio and Fundamental tab data – how to read, understand and utilize the metrics provided.
Register using the button below. A confirmation email will be sent with a link to join for the scheduled time.
Key Ratio Tab
Key Ratio analysis is just one approach to evaluating stocks, and it should be complemented with other forms of analysis, such as technical analysis and market sentiment, for a well-rounded investment decision.
Key ratio indicators provide valuable information about a company’s financial health, profitability, growth prospects, operational efficiency, and overall value enabling traders to make more informed decisions:
Valuation: Helps determine whether a stock is priced attractively in relation to its earnings, sales, or book value.
Profitability: Signifies a company’s ability to generate returns for its shareholders.
Financial Strength: Assesses the ability to meet financial obligations and weather economic downturns.
Growth: Analyzes potential for expansion and increased earnings over time.
Efficiency: Measures how effectively a company utilizes its resources to generate output.
Cash Flow: Provides insights into the company’s ability to generate and manage cash.
Fundamental Tab
Fundamental Analysis involves a comprehensive examination of a stock’s financial health and its underlying value, as well as other relevant financial and non-financial metrics, to form an overall view of a company’s financial health and value.
This information is displayed in charts and graphs making it more useful in the analysis process.
It’s important to note that fundamental analysis is just one approach to evaluating stocks, and it should be complemented with other forms of analysis, such as technical analysis and market sentiment, for a well-rounded investment decision.
Enhancements
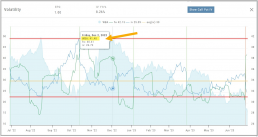
Price has been added to the Volatility Chart on the Option Chain display. Slide your cursor along the chart to display the Date, Price, HV & IV
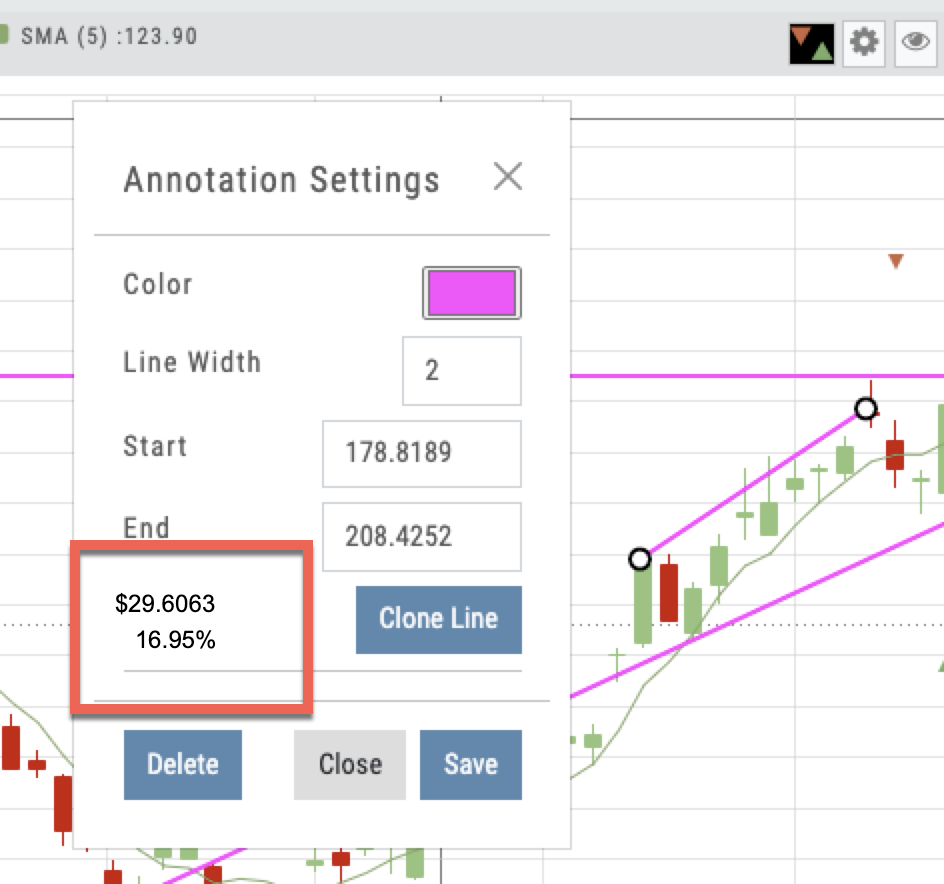
Dollar and Percentage Move added to Line Settings:
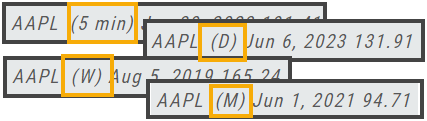
Timeframe displayed on chart when not on “Favorite”:
Font Size Selector for Price Chart
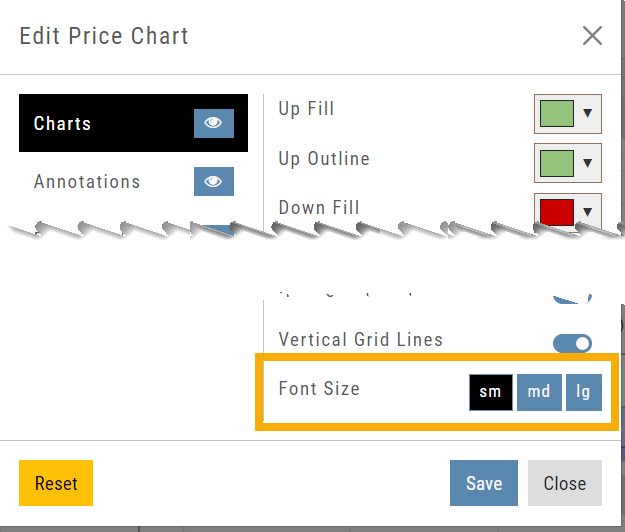
Vega added to Strategy Templates. Click the ‘expand’ icon, if needed:

Change Log
- Linear Regression Channel period number updating
- Roll-out time icon synced with Risk Graph
- Added “No or Limited Dividend Information” message
- Corrected Backtest Net Debit/Net Credit responsiveness
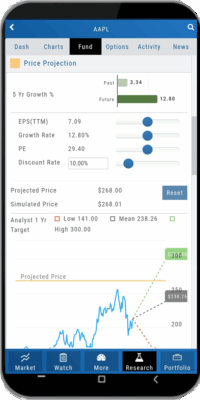
- Reset button function restored on Projected Price
Platform Features Release: April 2023
Announcing the latest feature(s)/function(s) updates, additions, or edits to the trading platform:
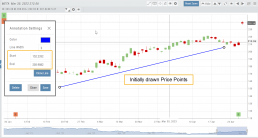
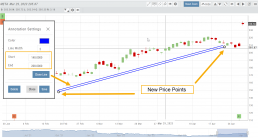
Cloning and Editing Trendlines
New Trendline Customization
Clone trendlines with the push of a button. Easily define or edit trendline endpoints.
Click on an existing trendline to display the Annotation Settings box, make your changes, then click “Save”.
Enhancements
- Reusing canceled GTC Order preserves Duration
Change Log
- Repaired contrast on Find>Scans>Filter table
- Chart crosshair behavior resolved
- Pivot Point indicator editing restored
- Removed duplicate Inner Circle>Insider Information
- Platform Notification>“Don’t show again” fixed
- Backtest>Analyze Date selection repaired
- Corrected date display above chart
- Seasonality Chart behavior corrected
- Screener functionality repaired on several items
- Hide function on Option functionality restored
- Russell 2000 restored on Find>HeatMap
- Backend fixes on previous releases
- Net Debit/Credit responsiveness restored on Manual Accounts
Platform Features Release: March 2023
Announcing the latest features/functions updates, additions, or edits to the trading platform:
Valuation and Fundamental Data Points added
Users have more criteria to select from for both the Screener, to find potential trade candidates, and Watchlist Views to analyze candidates.
Valuation and Fundamental Data Points Added
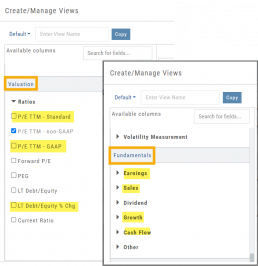
Watch List Views
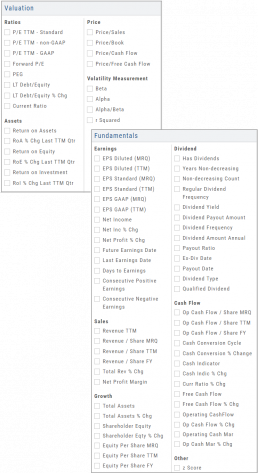
Over 30 data points were added to the Valuation and Fundamental sections for Watch List Views.
Build, Save, and Edit your customized Watch List Views to your needs.
Learn how to use this feature:
Screener
Over 30 data points have been added to the Screener Function under the Valuation and Fundamental sections.
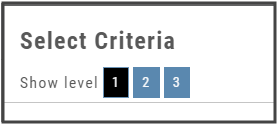
There are 3 Levels of Data Points. Level 2 has more Data Points than 1, Level 3 has all criteria available to select from.
Now users have more tools to choose customize screens. These may be saved and edited at any time.
Enhancements
- Added Average Volume line to (upper) Volume Indicator
- Saving Annotations/Texts, etc on charts are an automatic function. It no longer has to be selected.
- Scroll function added to lists on Custom, Market and Watch pages
- GAAP/non-GAAP PE/PEG (TPE and PE chart in Valuation section to reflect GAAP PE)
Change Log
- Resolved Screener Export Function
- Open/Close “save” function fixed in Backtest mode
- 2nd email saving in Notification feature setup
- Candlesticks and Volume bars line up
Platform Features Release: December 2022
Announcing the latest Release which added a powerful Lower Indicator on the Charts Tab: 52 Week Hi/Lo. Price/Date info has been added to X/Y axis
52-Week Hi/Low Indicator
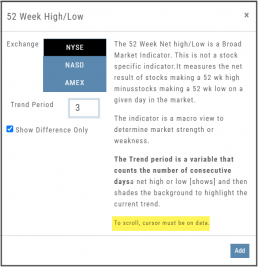
The newest lower indicator: 52-week Hi/Low Indicator is a Broad Market Indicator. It is not Stock specific.
View how individual Stocks/ETFs are faring compared to the Broad Market.
Select from NYSE, NASD or AmEx
There are two views:
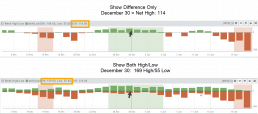
Show Difference Only – Display either a green or red (or no) bar representing the net advancers/decliners for that period.
Show High & Low (uncheck box)– Displays both green/red bars to illustrate number with new 52 week high/lows.
The background color identifies a bullish or bearish trend, based upon the number of days selected (Trend Period)
Example: If 3 days are selected, background highlight will begin on the 4th consecutive day of gains (or losses).
X/Y axis – Price/Date display
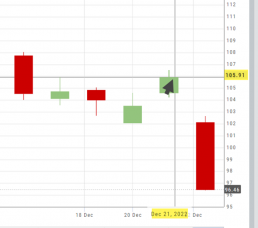
The cursor’s crosshairs will display the Price/Date info along the X/Y axis for easier reading.
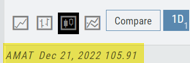
This information will still appear in the upper/right corner above the chart:
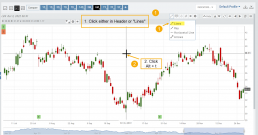
Drawing Key Activation
Use your keypad to activate drawing lines on the Chart by following these steps:
1. Click either in Header area above the chart – OR –
Click the Annotation icon>Line
2. Click on chart, then “Alt” and “T” keys where you want to start line.
Once activated from either of the starting points (1), the function works on the current chart, without having to reactivate by clicking on the Header or Annotation icon.