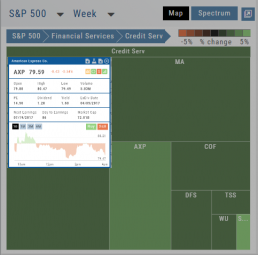
Heat Map & Spectrum Overview
For Example: Clicking on “Financial Services” industry portion on the map of the S&P 500, then “Credit Services” will yield another map of 8 companies: Visa, Mastercard, American Express, etc. Clicking on any of those boxes will display the Stock info at a glance. Notice the Navigation Icons such at The Score as well as those to add to a Watchlist or send to Research.
The “Spectrum” View maps the sectors within the Index, with the number of companies in (parenthesis) by the performance by the time-frame selected. You can drill-down by selecting the sector group, then industry and company.
Note: By selecting the “Go Big” Icon, ![]() , in the upper-right corner of the corner of the panel, expands the amount of information and navigational icons.
, in the upper-right corner of the corner of the panel, expands the amount of information and navigational icons.
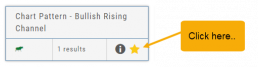
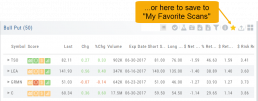
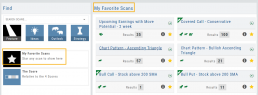
Save your Favorite Scans
Create your Customized Scan List
Star any scan to have it show in Feature > My Favorite Scans.
There are two ways to do this:
Simply click the star ![]() on the Tile View of the scans or on the header in the results view of any scan.
on the Tile View of the scans or on the header in the results view of any scan.
Favorites will be easily access from the Scan main page
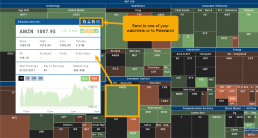
Heat Maps Too
The Heat Maps on the Market page offer the ability to drill down to the stock level. You are able to do this with both the Map and Spectrum views. Clicking on a stock will also show the quote detail. From this you can also send to a list or research.
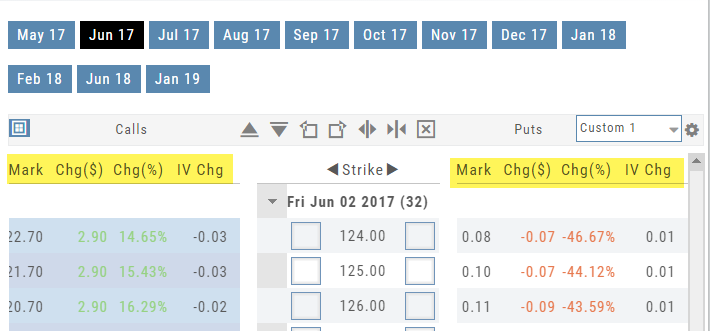
Additional Option Criteria
More Option Choices for Customized Option Tables
Mark: The mid-point price between the option’s Bid and Ask
$ Change
% Change
IV Change
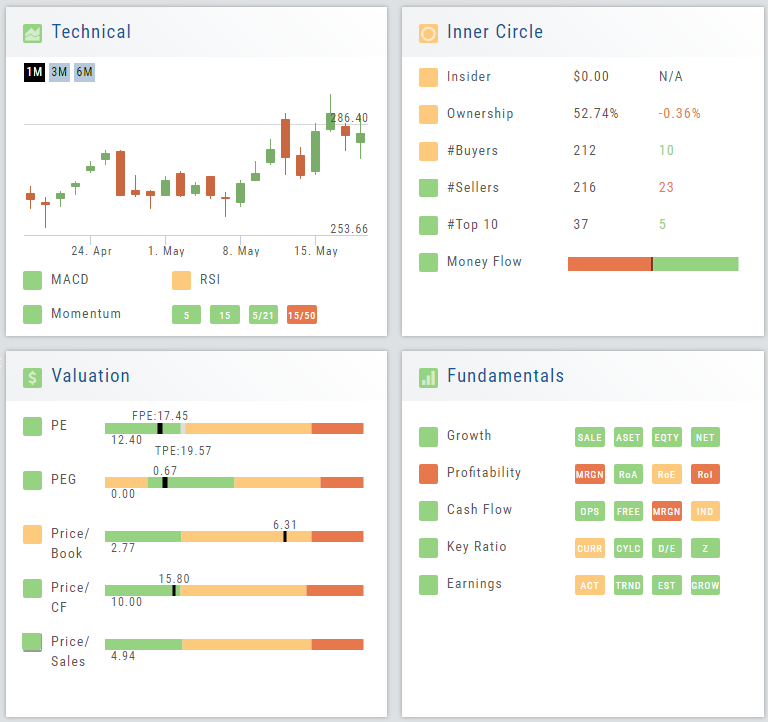
Valuation
Is it Overvalued or Undervalued?
Valuation looks at Key Ratios and Projected Price to evaluate the stock’s current value.
Key Ratios like both trailing and forward PE along with PEG (Price/Earnings/Growth) are weighed.
The Price compared to Book (flow of business), Cash Flow, and Sales are also very important factors to provide a well-rounded synopsis of the valuation modeling of the stock.
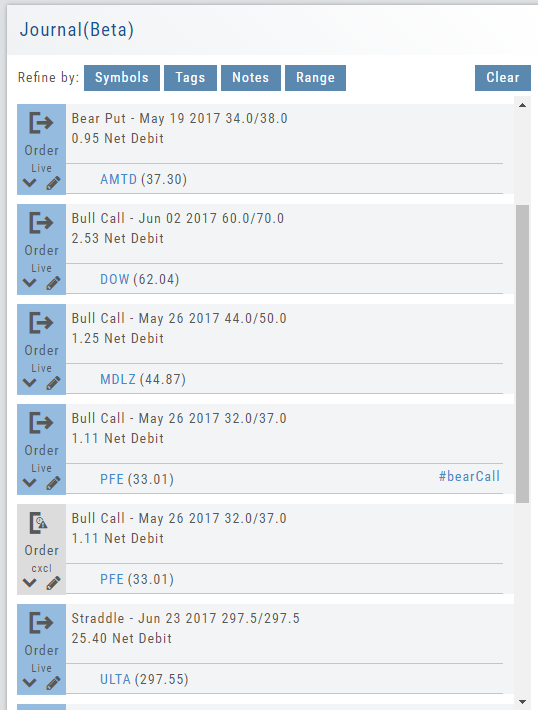
Journal Navigation
![]()
It’s easy to look up trades. Choose from Stock symbols, tags used (ex: #bullCall, #longStraddle), Notes containing certain words or phrases, or date ranges from 1 Day to 1 Year.
On the individual Trade tabs, click the ![]() icon to expand the trade detail. To edit/add tags, notes, to the trade entry, click
icon to expand the trade detail. To edit/add tags, notes, to the trade entry, click ![]() then ‘save’ when completed.
then ‘save’ when completed.
Once the Trade Tab is expanding , you have additional options: The “Replay” icon, ![]() , sends a trade from the Journal to Backtest Analysis. You can delete a Journal Entry by clicking on
, sends a trade from the Journal to Backtest Analysis. You can delete a Journal Entry by clicking on ![]() .
.
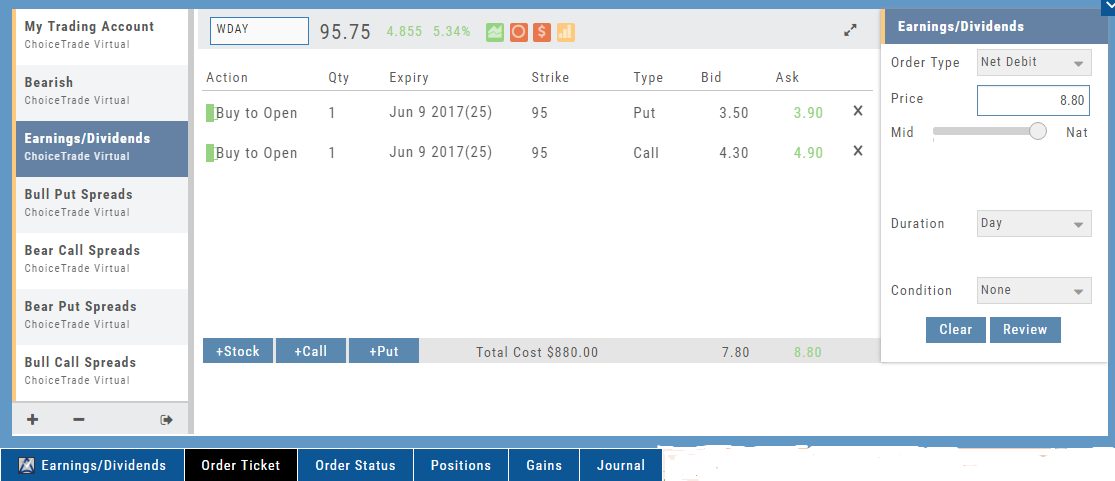
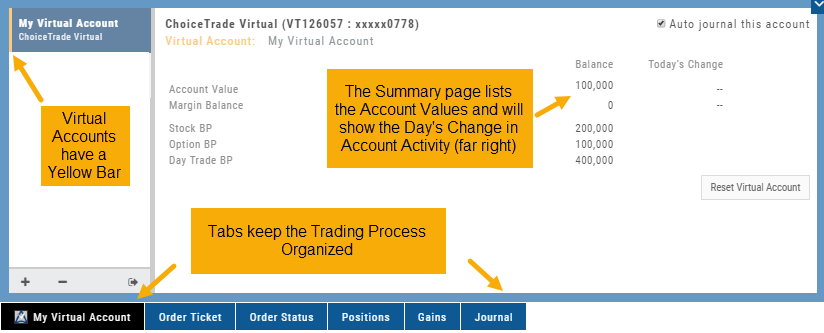
Virtual Account Overview
Virtual Trading gives you the real trading experience without risking any money. It is a valuable “next step” learning tool – designed to mimic the trading experience as closely as possible.
Trades are executed during Market hours – 9:30 a.m. – 4 p.m. Eastern Time, however there is a 15 minute delay after Market open for orders to begin executing.
As with Live Accounts, there are limits on trades if there is not sufficient Buying Power in your Virtual Account. There can be expensive Spread/Margin Requirements to adhere to.
Virtual Accounts do have limitations that Live Accounts do not have:
Virtual Accounts are not subject or responsive to Corporate actions such as buyouts, name or symbol changes, stock/option splits and strike price adjustments to name some examples.
![]()
Virtual Accounts are “Auto-Journaled”. This automatically keeps record of all trades for later analysis and reconciling.
These practice accounts are identified by a yellow bar on the left side of the account window.
Virtual Accounts are powered by Choice Trade to provide the real trading experience.
Snapshot: Comparing Positions
The Snapshot feature gives you the ability to compare up to three scenarios in one view without having to change screens or erase previous setups. You can even submit a trade from this part of the platform!
- From the Calls+Puts chain (as well as “Calls” or “Puts”) enter the initial trade position.
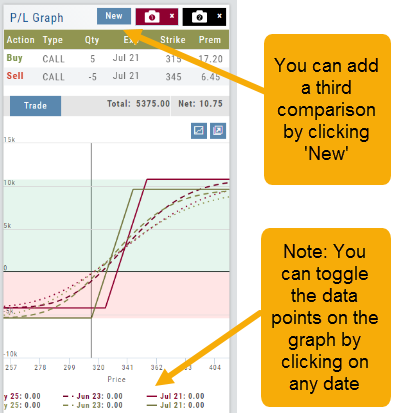
- Next click one of the camera icons:

- Repeat the first step using the Rolling Icons to adjust the initial position to a new scenario:
- Click the 2nd camera icon & repeat the above steps for the last trade comparison.
Note: The position lines are color coded to match the Snapshot (or New) icon.
Once you decide on the optimal position, click ‘Trade’ from the P&L Graph and you’ll be taken to the Order Ticket of your brokerage account with the option information auto-filled. 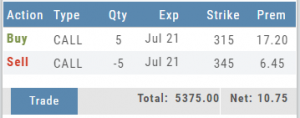

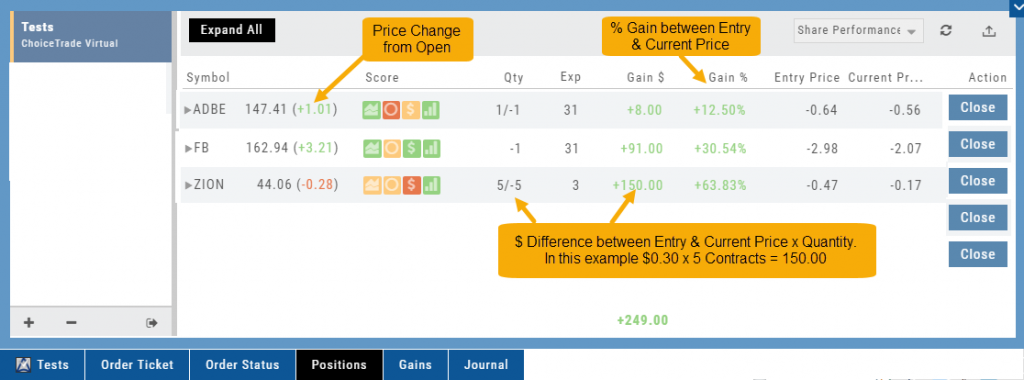
Portfolio - Positions
Share Performance View
This view keeps information simple. Aside from the Stock symbol, latest stock price, (price change since open), The Score, Quantity (Lots/Contracts), it shows:
$ Gain (Entry Price – Current Price)
% Gain ($ Gain / Entry price)
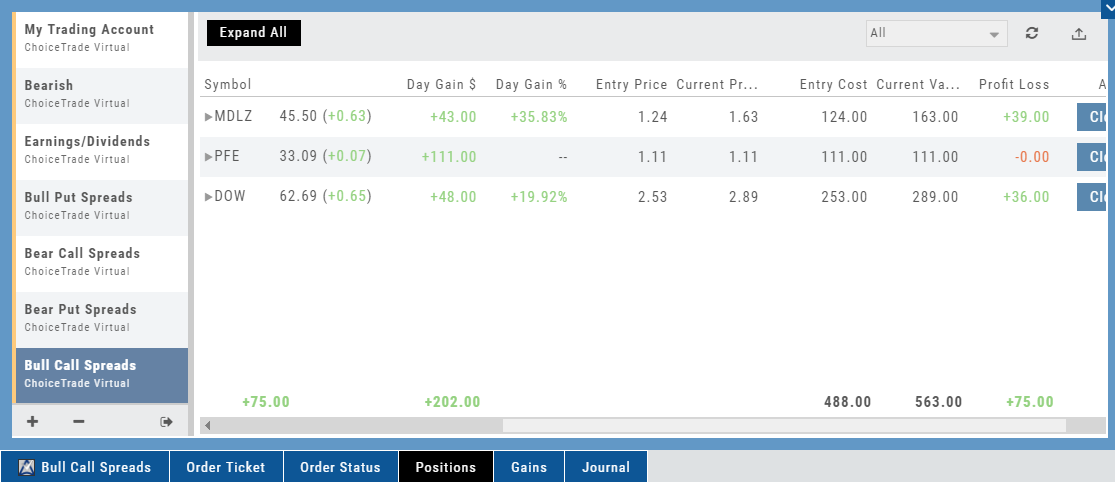
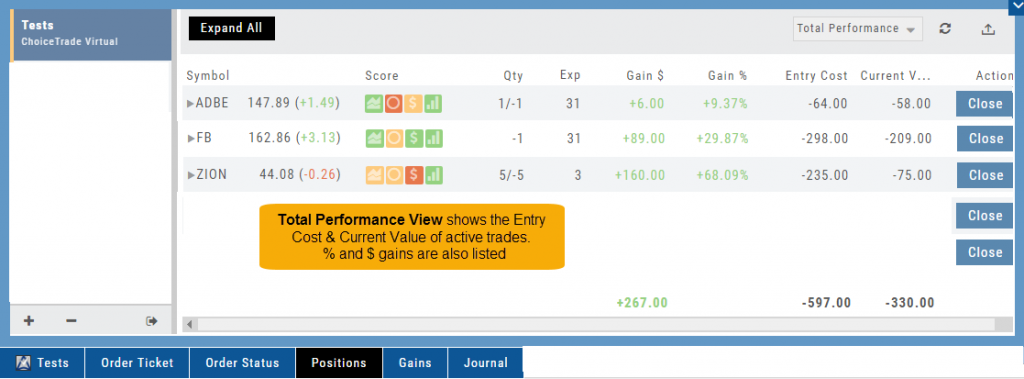
Total Performance View
Similar to Share Performance, this view shows the Entry Cost and Current Value of active trades.
$ Gain and % Gain values are calculated the same way as in the Share Performance view.
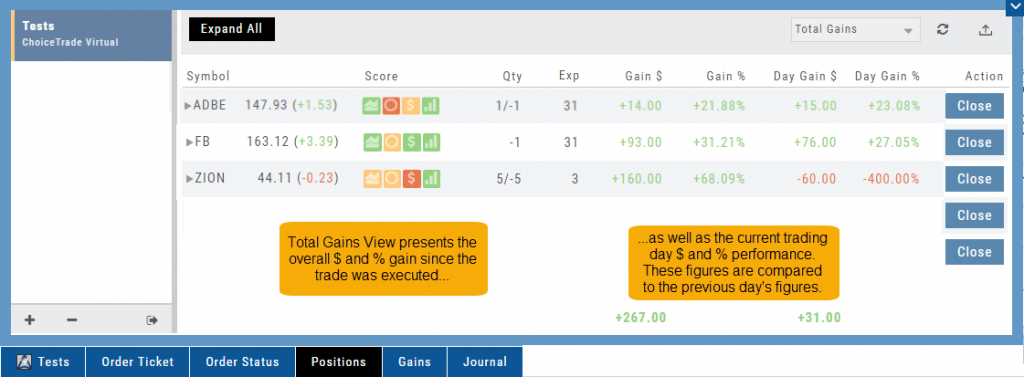
Total Gains
In addition to Gains $ and Gain %, which are to-date values since the trade’s inception, this view displays Day Gain $ and %. The latter show performance on the current trading day in relation to the previous trading day.
In this example on ZION: The previous trading day the $ Gain = $220, and Current Value = $15.00.
The Current Value ‘today’ is $60.00 (a 400% change).
Access Trading Account Information
No need to login to Brokerage Account site for normal day-to-day activity.
Each account includes a Summary page showing the Account Balance, Margin Balance, Stock, Option & Day Trading Buying Power and tracks the current trading day’s activity.
Besides the Order Ticket, the Order Status, Current Positions & Transaction History are all available. You can view previous order history in the Order Status tab by clicking on the drop-down menu on the upper-right corner of that screen.
You can access any account and switch accounts with a single click. You can even change the account from the order ticket.
The newest feature, Journal provides the means of organizing, noting, analyzing & reconciling trades.