Options Navigation
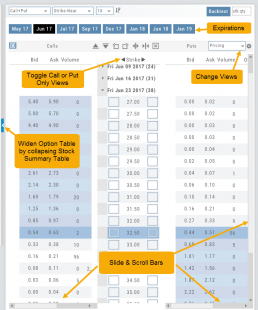
Expirations are displayed above the Option Table.
Select the months to view by clicking on the appropriate box. All available dates are displayed. Remember, the further out the option expiration is, the fewer dates are available.
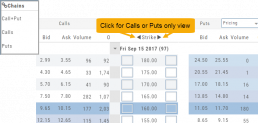
Toggle between Calls Only or Puts Only view.
Change Option Table views to Pricing, Value, Greeks, Trade or new Custom views you create to suit your needs.
The small tab on the left side of the table will collapse the stock summary box & widen the option table.
The scroll bar on the right side and slide bars at the bottom on the table offer additional navigation.
The Power of "The Score"
Our Proprietary Scoring System: Technical Analysis, Inner Circle, Valuation, and Fundamentals.
Designed with your workflow in mind and to give you the level of information you want, while keeping it out of the way when you don’t.
The order of The Score is based on the speed at which the stock is affected: Technicals being the fastest, and Fundamentals the slowest. For example, a very short term trader may not put as much weight on Fundamentals as with the Chart. However, as an actively managing investor, Fundamentals will be more influential on your trades.
Overview of Scans
Want some ideas to take advantage of market conditions? This is the place to find Stock and Option opportunities based on bullish, bearish and stagnant outlook.
Choose from dozens of scans based on events or components of “The Score”: Fundamentals, Valuation, Technical & Inner Circle. 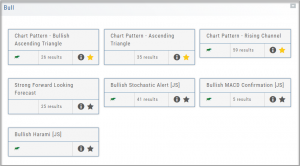
Ideas and Features offer even more opportunities.
The [i] icon provides a short explanation of the strategy.
Best of all, you are able to keep your favorites all in one place by ‘starring’ it for future use.
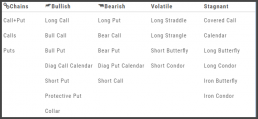
The Top 4 Categories
The names may be different, but the scans remain the same! 
Feature – Your favorite and our highlighted scans, including scans related to The Score.
Ideas – Scans for general ideas including Dividends, Money Flow, Volatility, Earnings and more.
Outlook – For Bearish, Bullish and Stagnant outlook conditions.
Strategy – Over 20 strategy-specific scans including Bull Put, Bear Call, Iron Condor and more.
Technical Analysis
Technicals: The fastest indicators of The Score
In Technical Score, 3 primary categories of studies are evaluated – MACD, RSI, and Momentum.
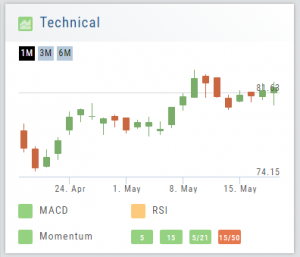
Momentum is made up of 4 different trend analysis timelines.
5 = Stock over the 5-day moving average
15 = Stock over the 15-day moving average
5/21 = 5-day moving average over the 21-day moving average
15/50 = 15-day moving average over the 50 day moving average
Note: Momentum indication is from fastest to slowest. This can be helpful in determining your time frame/outlook for the appropriate strategies.
By clicking on the Technical Score Icon anywhere in the platform, you’ll be taken to the Chart Tab under Research for that Company/Symbol.
Go to Charts for more in-depth information.
Chain Views
Different views are available for options such as Calls + Puts, Calls only or Puts only. Select from the drop-down box or toggle the screen using the arrows ![]() in the chain header.
in the chain header.
In addition, there are over 20 strategy templates on the Options tab.
Option Tables & Templates
Expanding your Options!
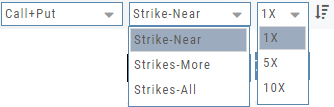
Choose from Call+Put chains, Call Matrix, Put Matrix or from almost 2 dozen Option Templates – covering any market outlook.
Expand the Strikes displayed: Near ATM, More or All.
You can change the click Quantity default increment by changing the default parameter for 1x, 5x or 10x.
You can also sort the Strike prices: Lowest to Highest, or vice-versa.
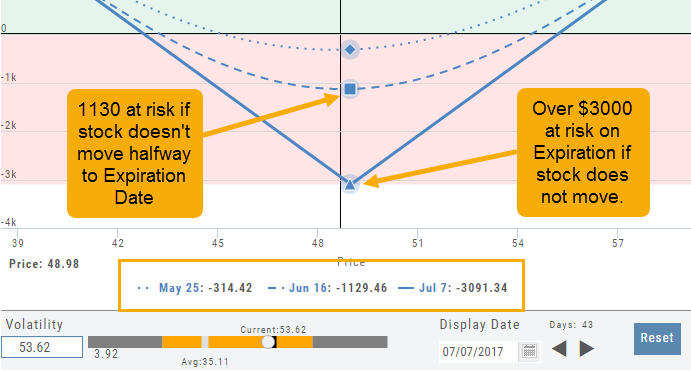
Advanced Analytics
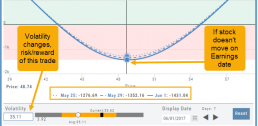
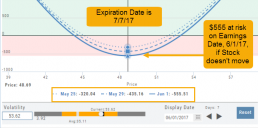
Some strategies are more responsive to time decay and/or volatility than others. This platform has tools to help analyze these components.
- Construct the position in the Option Chain table
- Select the ‘Go Big’ icon on the P&L Graph
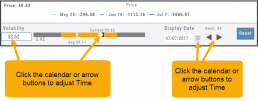
- The Graph shows 3 data points: Current Day, Halfway point to Expiration Day & Expiration Day. The corresponding legend, immediately below the graph, follows the cursor slider along the graph.
- The bottom of the screen contains a Calendar (Time) & Volatility Scale. Both can be manipulated to analyze the position.
Time: You can select a date to analyze as well as user stepper buttons to move day by day backward or forward.
Volatility: Use the volatility slider or enter a value in the entry box to see the impact of changes in volatility. The slider bar also displays the current (circle), average (gray), and 1 year high / low of implied volatility (orange portion of the slider) for easy reference.
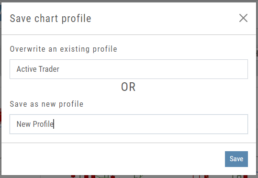
Add/Delete/Save Chart Profiles
Create multiple chart profiles for your analysis. Saved profiles will remember your settings: chart type, time frame including “Extend By 10,30,60 or 90 Days”, indicators, etc.
After you’ve set up your chart:
1. Click the ‘Save’ Icon
2. You’ll be prompted to Overwrite an existing profile or Save as a new profile**
3. Click ‘Save’ – (the box will disappear after a second or two)
That’s it!
You can remove unwanted profiles by clicking the [x] icon to delete, located next to the ‘Save’ icon.
**Note: Active Trader, Options, and Standard View are System views and cannot be altered or deleted. You will be prompted to save the new settings or overwrite a different view.
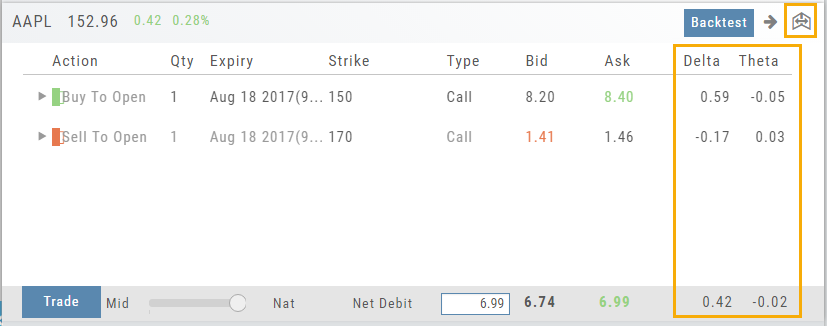
Delta & Theta Display on Template
You can expand the template to show Delta and Theta for the individual legs as well as the totals for the trade by clicking the ![]() icon on the upper right part of this screen.
icon on the upper right part of this screen.
This can help for faster evaluation and better positioning of the trade.