Strategy Template
A Strategy Template provides a shortcut to quickly create an option strategy, virtually eliminating structure errors. Once selected, you can modify the structure within the template using the tools on above the option tables: Moving Strikes up/down, rolling Time out/in, widening or narrowing Strikes.
![]()
Some strategies can be changed from all Calls to all Puts (and vice-versa).
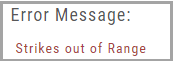
Note: The templates will not allow you to exceed certain parameters, as attempting to do so would result in an invalid strategy. This is a built-in safety net and you would receive a notice similar to:
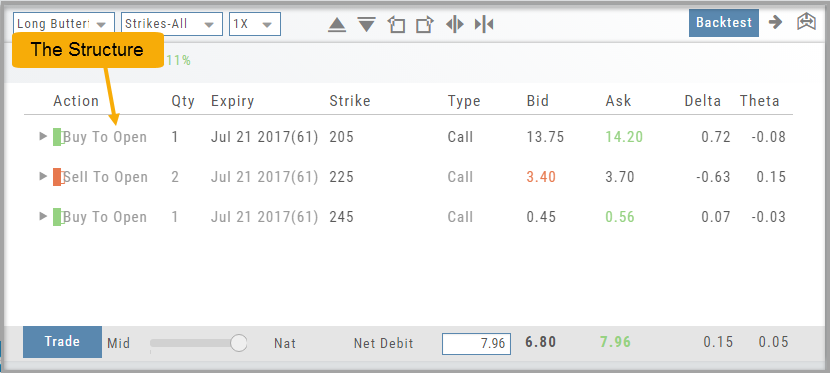
Storyboard of the Strategy
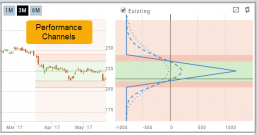
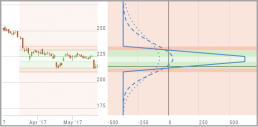
We also display a storyboard-like view of the selected strategy. It is a combination of chart, risk graph, and performance channel constructed within one panel.
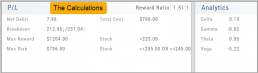
This storyboard gives you the full picture of the position: The Structure, Performance Channels and Calculations.
Designed to provide the level of information you want
As much information you want. When you want it.
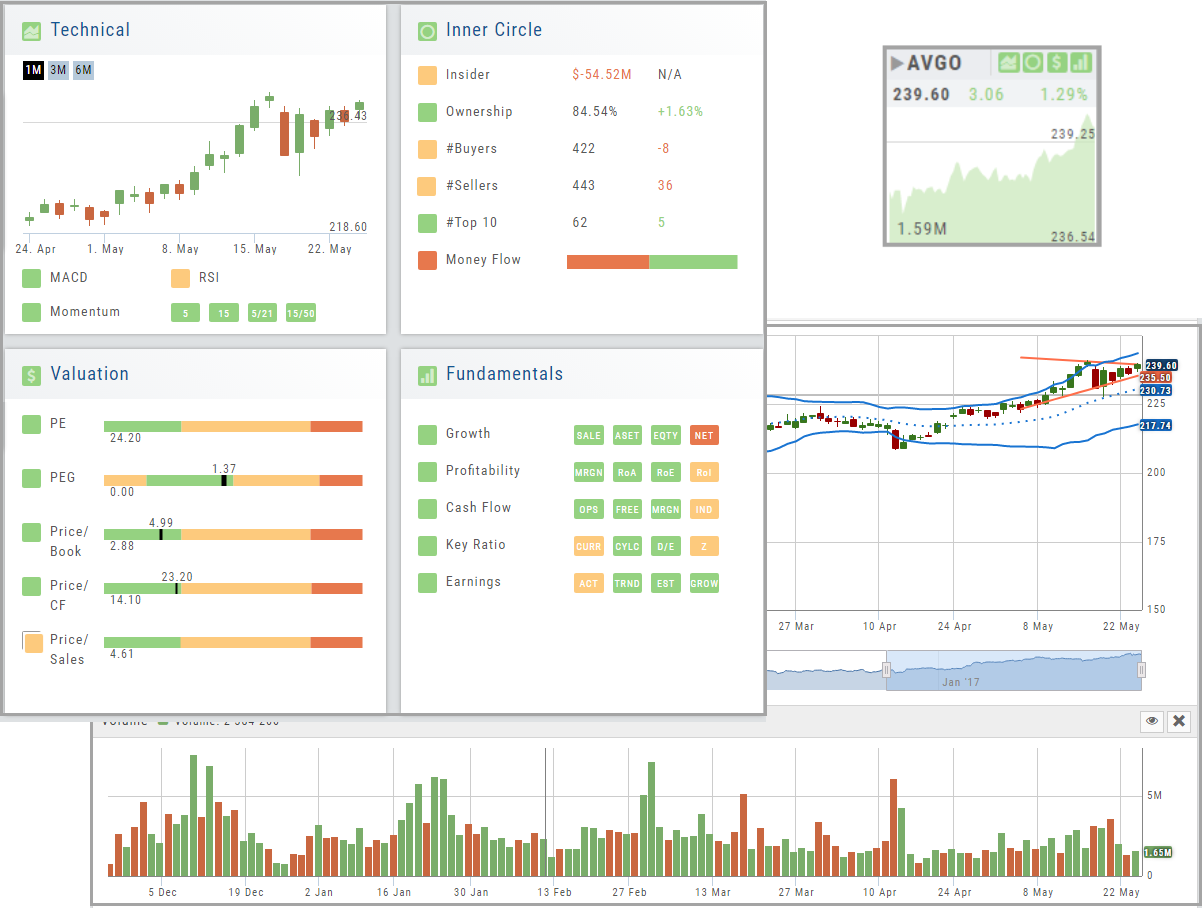
Each of our scoring algorithms are derived from several factors, all captured in a user-friendly format.
The stock dashboard provides a more detail summary layer view of The Score. Each component: Technical, Inner Circle, Valuation and Fundamentals allows you the ability to obtain the information you want, when you want it – and kept tucked away, when you don’t.
The Dashboard Scan Tab
Get the current ‘story’ on a stock.
The Scan Tab is particularly interesting. In addition to providing a list of scans the stock is currently included in, it can give you a “story” about the stock. Based on the scans that the stock is showing up in, you can get an overview of outlook on the stock.
For example: JNJ shows solid longer term positive outlook.
XOM Shows stagnant with improving longer term outlook

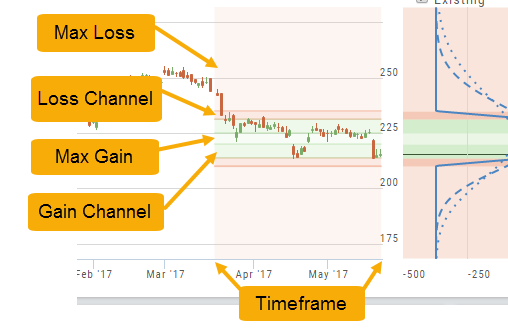
Performance Channels
Performance Channels can assist in visual analysis across both the P/L Graph and the Chart.
- Dark Green – Stock movement affects gain
- Light Green – At maximum gain
- Dark Red – Stock movement affects loss
- Light Red – At maximum loss
The width of the channel on the chart represents the timeframe of the trade. If options expire in 30 days, the channel will display back 30 days on the chart. This give a visual reference for the time frame of the trade.
Note: Channels are displayed based on expiration of the trade. Past performance is not indicative of future results. Performance channel date orientation is for reference only.
Earnings, Dividends and more...
The far right, lower box in Research provides the following:
Earnings Tab: Get Earnings date, number of business days until announcement, Estimated and Actual Trailing Twelve Months (TTM) EPS, and link to the prior 12 Quarter Earnings details.
Dividend Tab: Get Yield, Amount, Payout Ratio (dividend/EPS), the Ex-Dividend Date (deadline to complete a stock purchase to be entitled to dividends), Payout information, Frequency and link to the prior 12 Quarter Dividends.
Scans Tab: Quickly view how many & which scans the stock symbol appears on.
Index Tab: Lists the symbol and indices name(s) on which this stock appears.
Split Date: Provides most recent Split Date, Detail and a link to view Split History

Chart Navigation
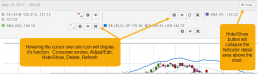
Hovering the cursor over the icons will display it’s function.
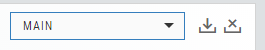
In the upper right of the Chart screen, you can select which Chart Profile to research from the drop-down box, then save or delete the profile.
The next set of icons immediately below this gives more charting capabilities: Increase/Decrease price ranges, Reset price range, Hide/Show Navigation Bar, Move the date Back/Forward, Export/Print Chart
![]()
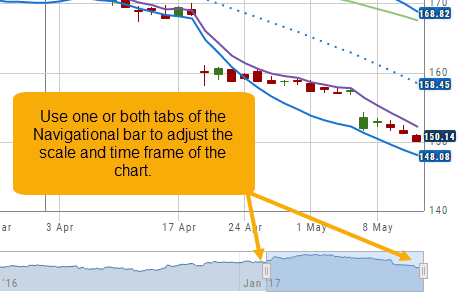
Other features include the Navigation Bar (below the chart). The shaded area corresponds to the chart time period. Slide one or both tabs of the bar to adjust the time period covered.
The “Hide/Show” button near the top-right of the screen will collapse the Indicator Detail area above the chart.
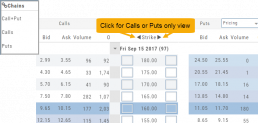
Chain Views
Different views are available for options such as Calls + Puts, Calls only or Puts only. Select from the drop-down box or toggle the screen using the arrows ![]() in the chain header.
in the chain header.
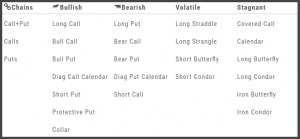
In addition, there are over 20 strategy templates on the Options tab.
Strategy Snapshot
It’s the “Cliffnotes” version of your strategy
Each strategy template provides a quick reference for the construction and application of the strategy. The snapshot shows:
- what the strategy outlook is on the color-coded range from ‘Very Bearish’, ‘Mildly Bearish’, ‘Neutral’, ‘Mildly Bullish’ or ‘Very Bullish’.
- what effect ‘time decay’ and ‘volatility’ has on the strategy: ‘Increase’, ‘Neutral’ or ‘Decrease’.
- debit or credit trade
- risk & reward level
- strategy structure
- an overview summary of the strategy
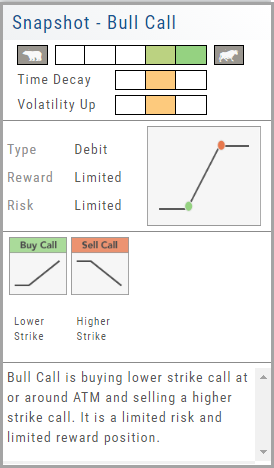
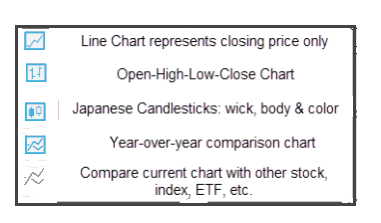
Chart Types
Lines, Bars, Candles & Comparisons
You have the flexibility in not only the way the data is displayed, but you also have choices in comparisons: Year-over-Year comparisons of your current Stock, up to a 5-year period. You can also compare your current stock to another stock, another index, ETF, etc.