Journal Reports
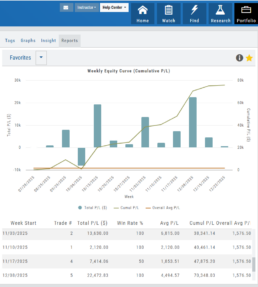
Understanding your trading performance shouldn’t require digging through spreadsheets or guesswork. Journal Reports turn your trading data into clear, visual insights—so you can quickly see what’s working, what’s not, and where to focus next.
With intuitive graphs and concise summary outlines, Journal Reports provide a high-level view of your account performance across multiple categories, helping you connect the dots between results, behavior, and decision-making.
Whether you’re reviewing weekly performance, refining your edge, or building better trading habits, Journal Reports transform raw data into actionable insight—at a glance.
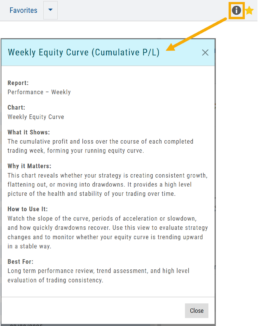
Click the Info Icon ![]() for a detailed outline on:
for a detailed outline on:
- What information the report provides
- Why it matters
- How to use it
- The application(s) the report is Best used for
Report Legend
Each Report has a legend where indicators can be toggled on/off simply by clicking on each one.
![]()
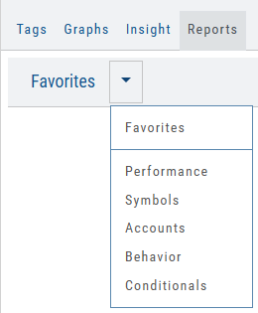
Journal Reports include insights by:
- Performance – Analyze results by time period to spot trends and consistency.
-
Symbols – Identify which tickers were your most and least profitable.
-
Account – Review performance across individual or multiple accounts.
- Behavior – See how trading habits impact outcomes.
-
Conditionals – Evaluate performance based on specific trade criteria or setups.
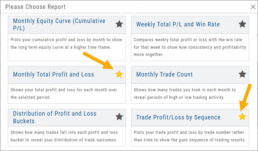
Click on one of the above categories, then click on the Report to display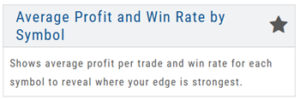
To make analysis even easier, users can group their Favorites into a single section—allowing you to focus on the symbols, strategies, or reports that matter most to you.
Simply, click the Star Icon to highlighteach Report to keep under “Favorites”
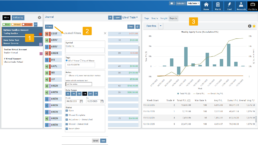
- The account(s) selected on the left side of the Portfolio Tab display the activity in the center panel for the default time period of 12 months
- Use the Filter Button to adjust the time period, symbols, etc to display
- The results from the center panel will be displayed on the right panel