Features Release Notes:
New Scans, Journal Summary, Analytical Graphs, Earnings Sort feature on select Scans
We’re pleased to announce new features and enhancements to the Trade Tool Trading Platform. The updates provide additional journal tools including Analytical Graphs, and Tag Summary report. New scans have been added providing more ways to find opportunities. Earnings date information has been added as a sort features on select scans.
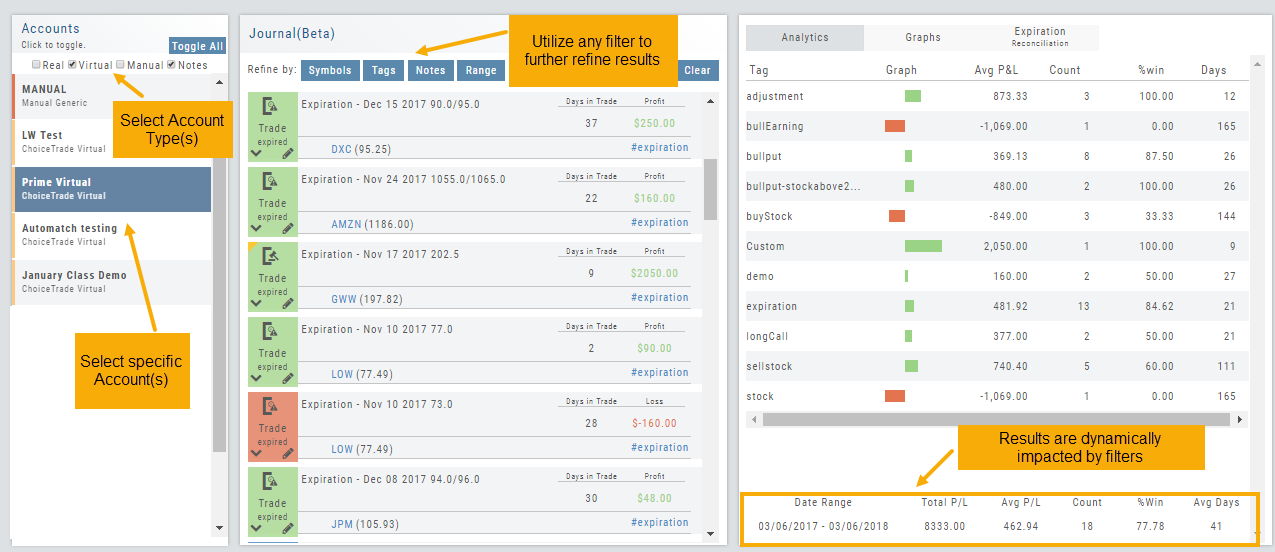
Tag Results Table Summary
A new Tag Results Summary Table was added below the Analytics Tab in the Journal. The data is dynamically impacted by the Account(s) and filters such as Date Range, Symbol and Tags.
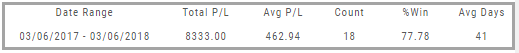
This powerful feature can be used to compare trade performance by account, by strategy, date range, etc.
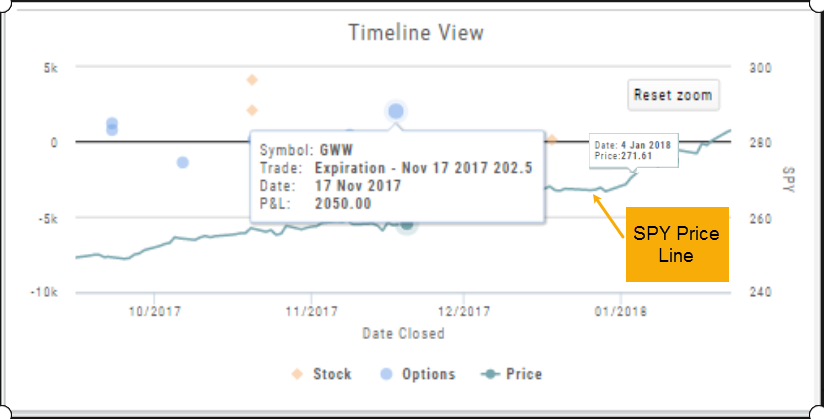
P/L by Duration & P/L by Timeline Graphs
A Graphs Tab was added to the Journal which provides two ways to view the P/L:
Duration: P/L by the Number of Days in a Trade
Timeline: P/L by the Close or Expiration Day
The data dynamically updates by Account(s) and Filters, such as Date Range, Symbols or Tags selected.
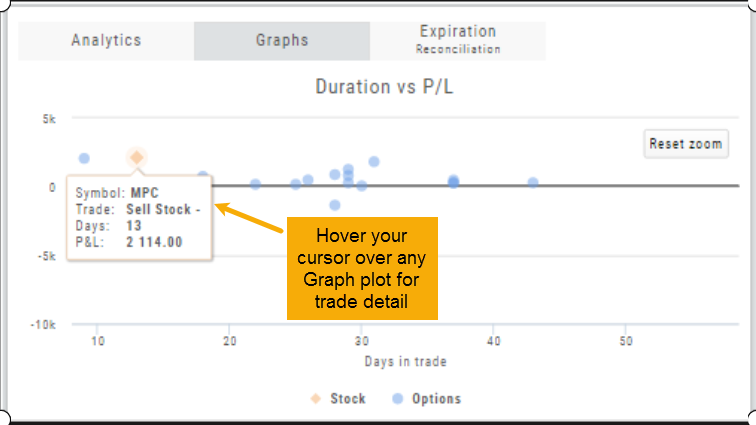
Diamonds represent Stock Trades, Circles represent Option Trades
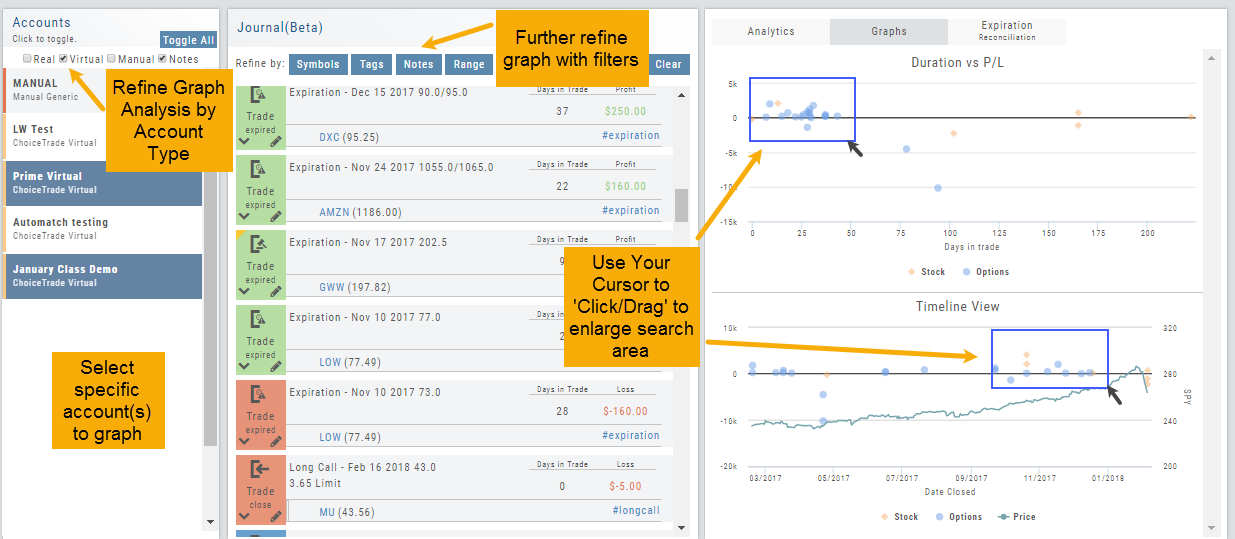
Click/Drag the cursor over the Graph to change/enlarge orientation (see below). Hover the cursor to see individual trade information.
SPY Price is shown on the Timeline Graph. Hover the cursor over the price line to see the close price on a specific date.
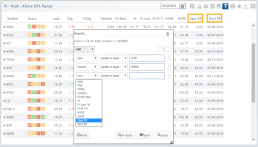
Earnings Data added to Select Scans
Earnings data has been added Chart Pattern and Volatility Scans. You can now sort scan results by Number of Days to Earnings (Days ER) or Earnings Date (Next ER).
New Bullish/Bearish Outlook Scans
New scans have been added giving you more ways to find trading opportunities based on outlook: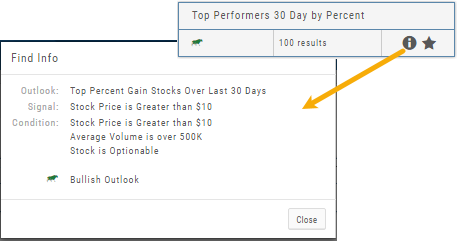
- Top 100 Stock Performers by Percent in the last 30 days, 90 days and 1 Year
- Golden Cross
- Death Cross
Click on the ![]() icon to get Scan detail. Click the ‘Star’ Icon to add to your ‘Favorites’.
icon to get Scan detail. Click the ‘Star’ Icon to add to your ‘Favorites’.
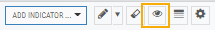
Other Added Features
- Hide Trend Line Option – Icon allows you to ‘clean up’ the chart to view certain aspects. Clicking the ‘eye’ icon allows you to hide the trend lines, clicking again displays them again.
- Insiders Fields – Color Coded based on impact
Change Log:
- Added Extension to Gains Tab download tab.
- Corrected Option Chain reset in Real Time.
- Restored Chart Max history to 25 years where available.
- ‘Extend By’ flags/other notification display repaired.
- GE Valuation data restored.