
TradeTool Platform
Release Notes
Chart Period Controls
Interval and Timeframe are now set independently, giving you more flexibility when setting up your charts.
What's new
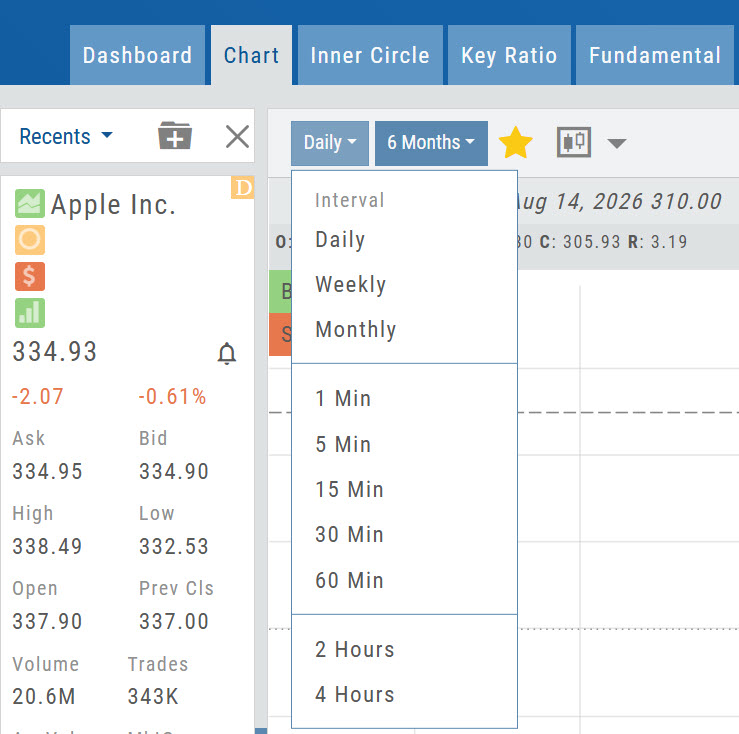
- Interval determines how each bar or candle is displayed — Daily, Weekly, Monthly, 1 Min through 60 Min, 2 Hours and 4 Hours.
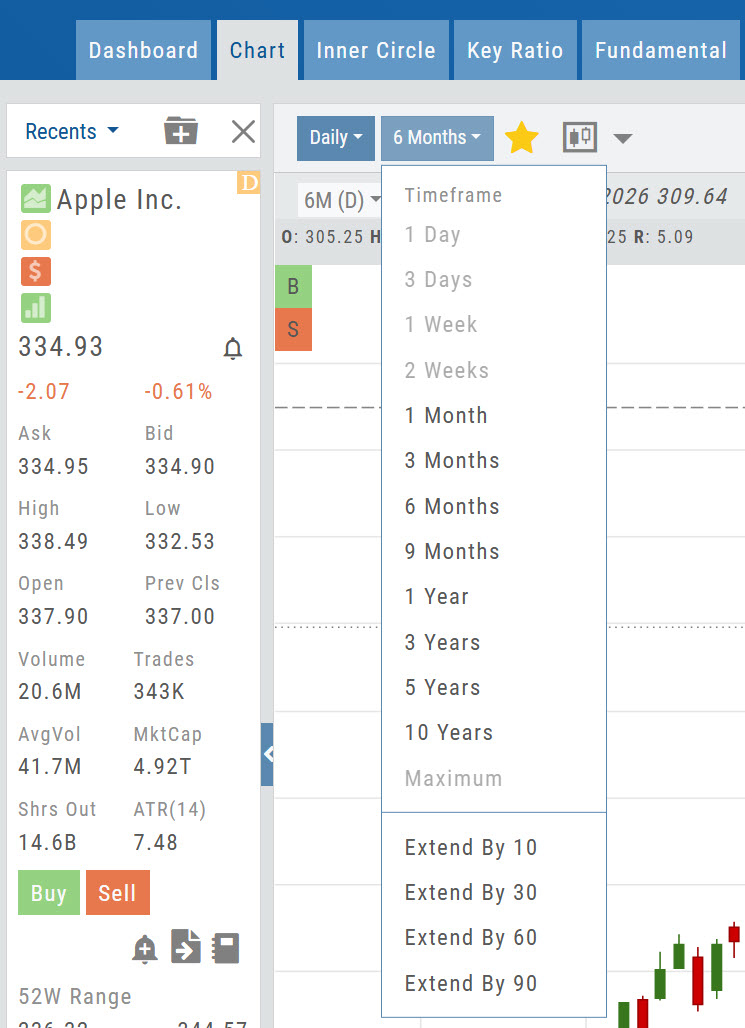
- Timeframe determines how much historical data is displayed — 1 Day through 10 Years.
- Extend By 10, 30, 60 or 90 periods is now available within the Timeframe menu.
- Your selections are sticky — they remain in place until you change them.
How the two menus work together
Compatible selections are shown normally, while unavailable combinations are faded. Selecting a 1 Min Interval, for example, allows Timeframes of 1 Day, 3 Days or 1 Week.
Access Your Favorites
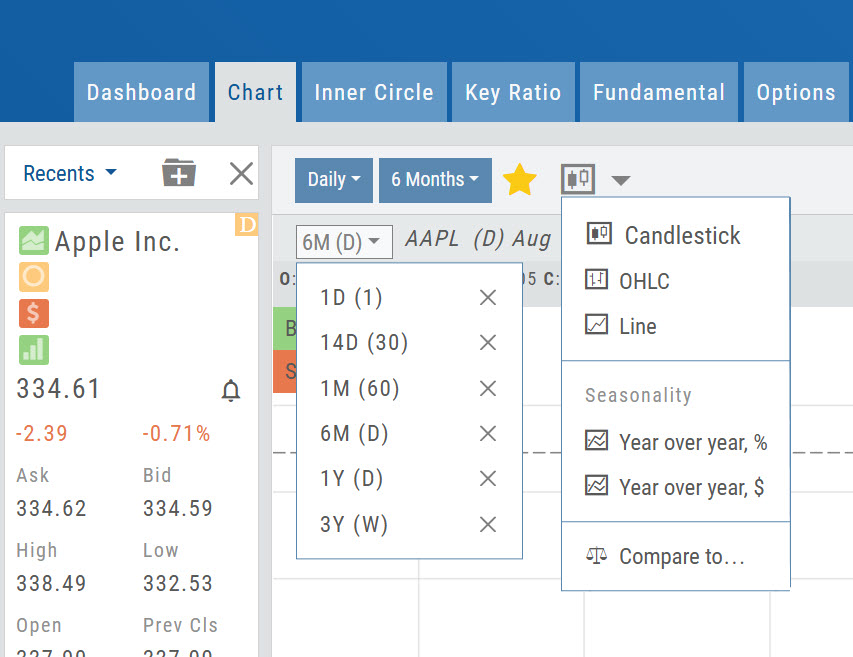
The Interval/Timeframes that are Starred, indicating “Favorites” are stored in this drop-down.
To add a new “Favorite” click the Star to the right of the new Interval/Timeframe combination.
To remove: Select the one to remove and click the highlighted Star to remove.
Note: Chart Views selection has been moved to its new location. Select Line, OHLC or (default) Candlestick. Seasonality and Compare function capability are also housed here.
Enhanced Trade Results in the Journal
The Trade Journal provides a more complete view of your trade results — from entry through close, including adjustments and expirations along the way.
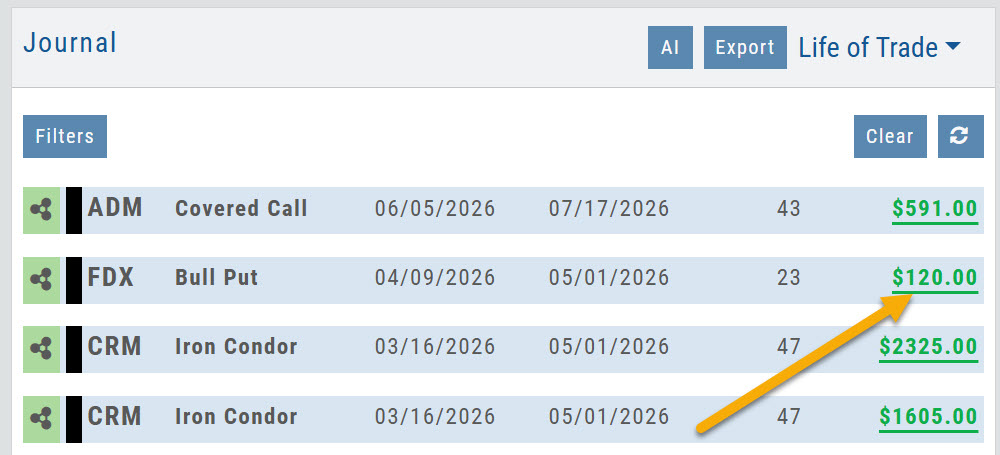
How to open it
From the Life of Trade view, click the Gain/Loss value on the far right of a completed trade.
What you'll see
- Trade performance at a glance — Profit/Loss, % of Target and trade duration.
- Visual trade history — entries, adjustments and exits shown directly on the chart, including OCO Stop and Limit orders when applicable.
- Risk & Return — compare the original trade plan with the actual outcome, including Reward and Return on Risk.
- Performance Evaluation — identify the factors that contributed to or detracted from the trade.
- Position & Plan details — see how the actual execution and results compared with the original plan.
- Options Trade Analysis — review key Greeks and volatility metrics, including Delta, Theta, Vega, Gamma, IV and IV Rank.
The tabs you see depend on the type of trade.
Stock trades
Summary · Risk & Return · Position & Plan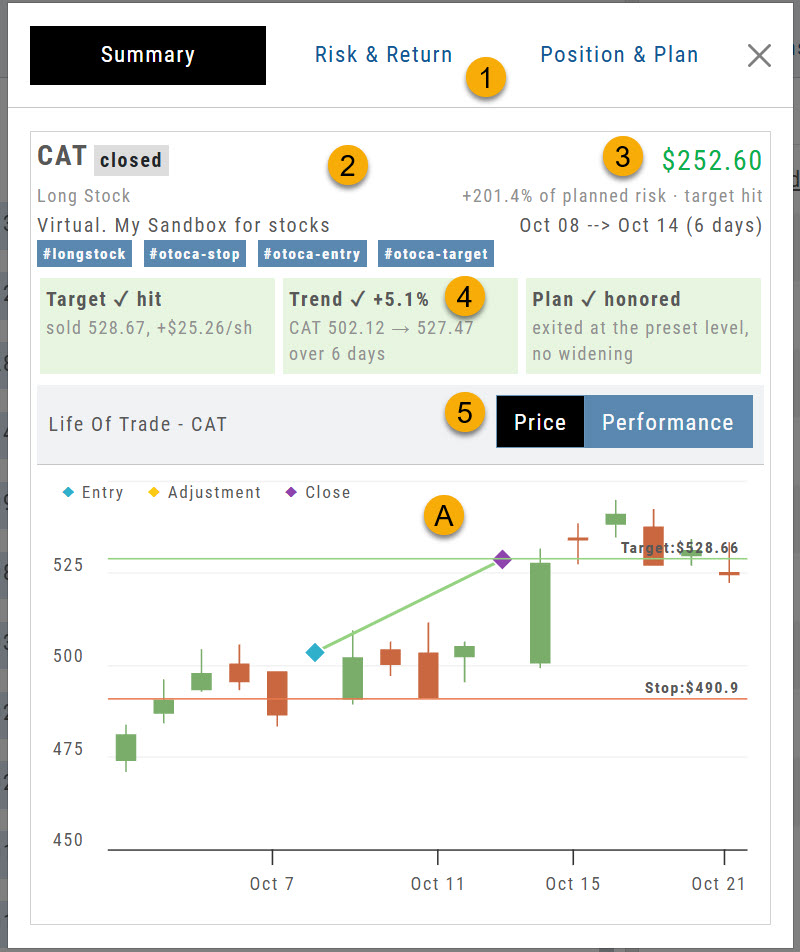
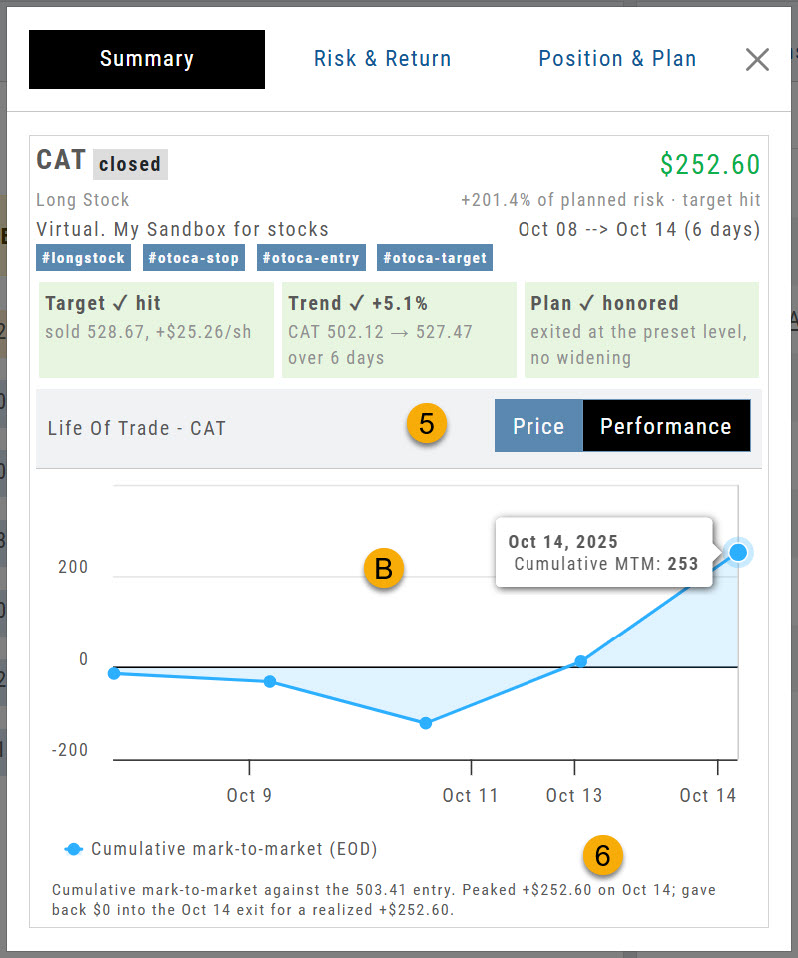
- Overview tabs — Summary, Risk & Return, Position & Plan.
- Trade summary — symbol, trade status, position, account and tags.
- Results — Profit/Loss, % of Target and duration of trade.
- Evaluation — color shows whether a factor contributed to or detracted from the trade.
- Price / Performance — toggle between the two chart views.
- ACandlestick chart with position entry, adjustment and close — plus OCO Stop and Limit, if applicable.
- BCumulative activity across the trade duration.
- Summary of performance — a plain-language recap of the result.
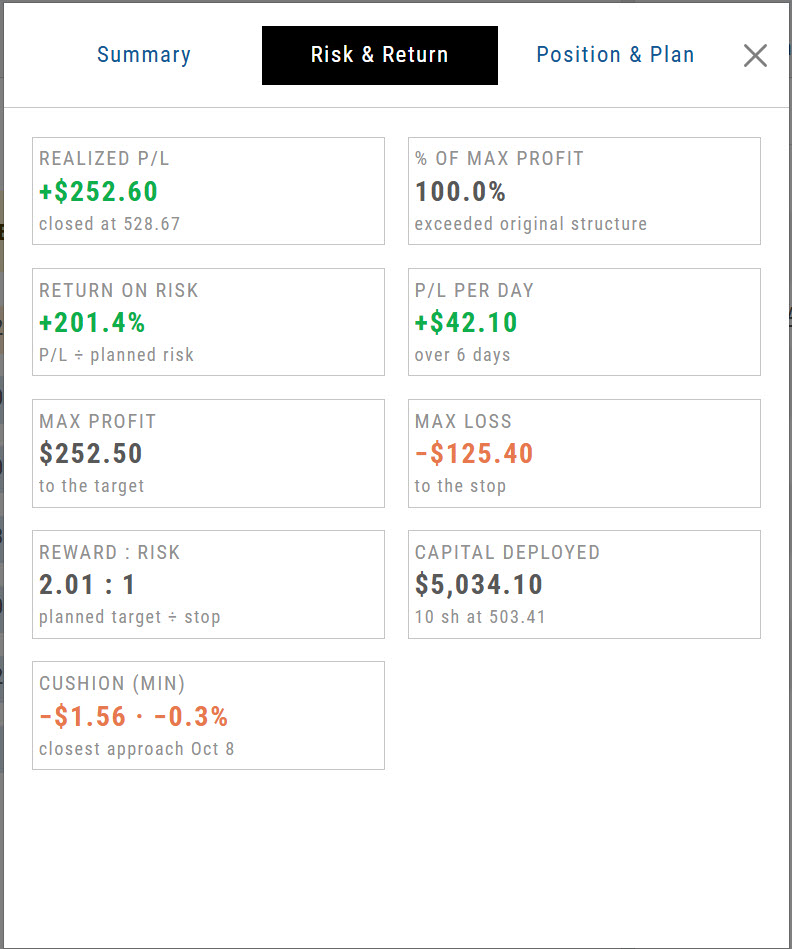
Risk & Return
Risk & Return sets the plan against the outcome. In this bracket order, 10 shares filled at $503.41 — below the $503.44 order price. Six days later the $528.66 target was reached and the close executed at $528.67, and the $490.90 stop was cancelled automatically. A planned Reward/Risk of 2.01 came in at 2.02.
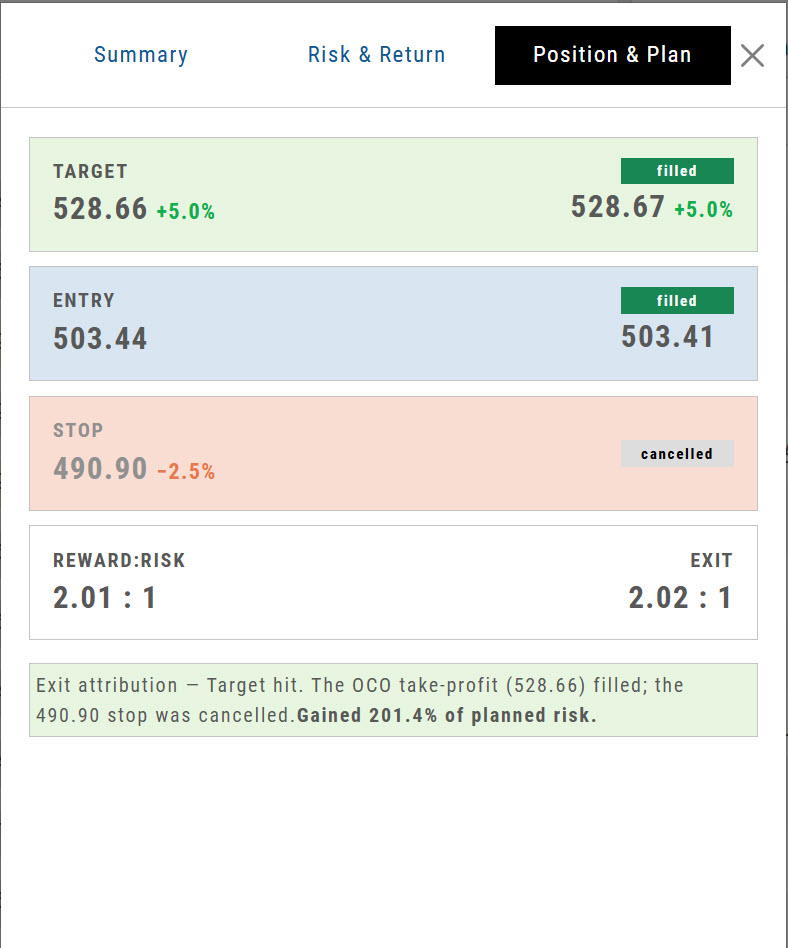
Position & Plan
Position & Plan breaks the result down line by line — here, a better entry, a better close, and a stop that never had to fill.
Options trades
Summary · Risk & Return · Greeks & IV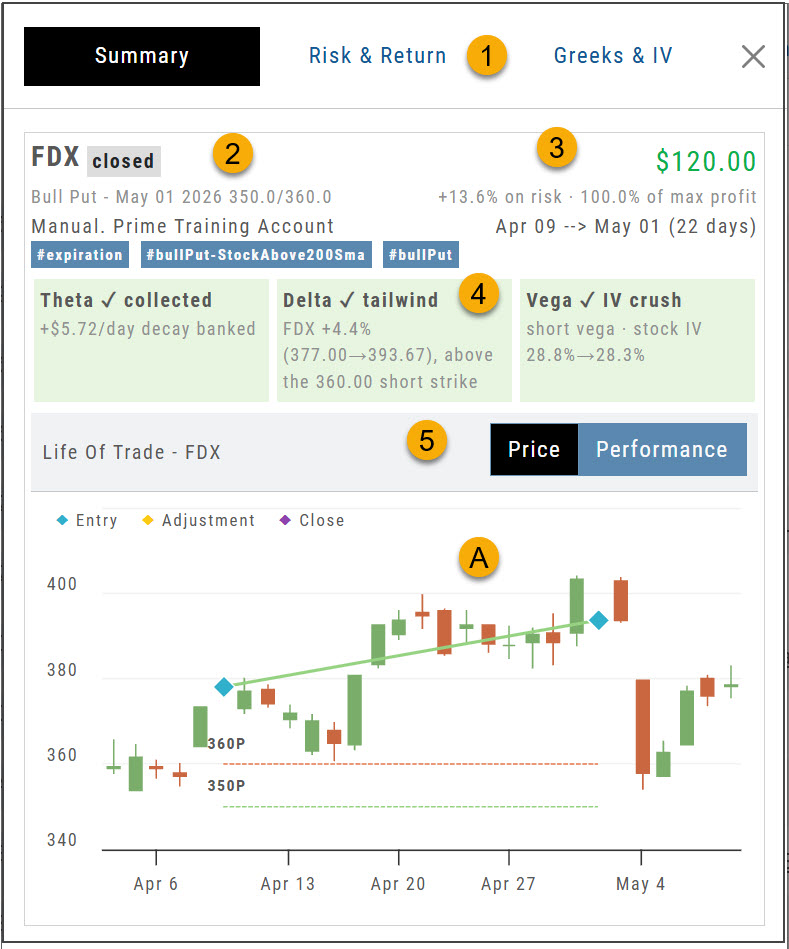
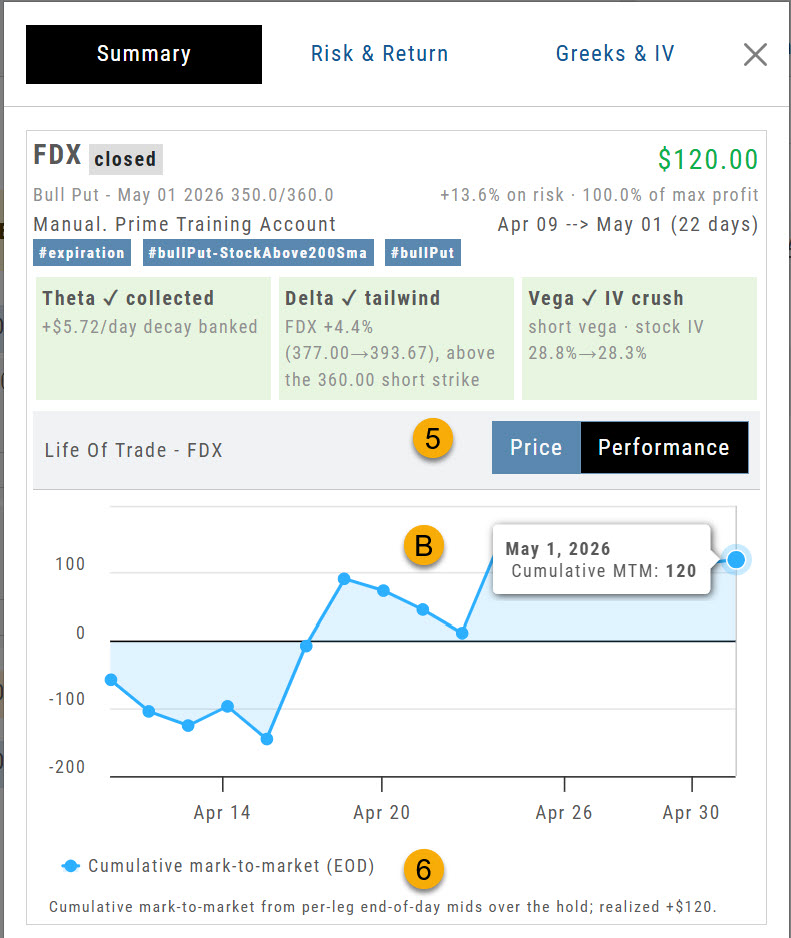
- Overview tabs — Summary, Risk & Return, Greeks & IV.
- Trade summary — symbol, trade status, position, account and tags.
- Results — Profit/Loss, % of Target and duration of trade.
- Evaluation — up to three primary drivers of the trade.
- Price / Performance — toggle between the two chart views.
- ACandlestick chart with position entry, adjustment and close.
- BCumulative activity across the trade duration.
- Summary of performance — a plain-language recap of the result.
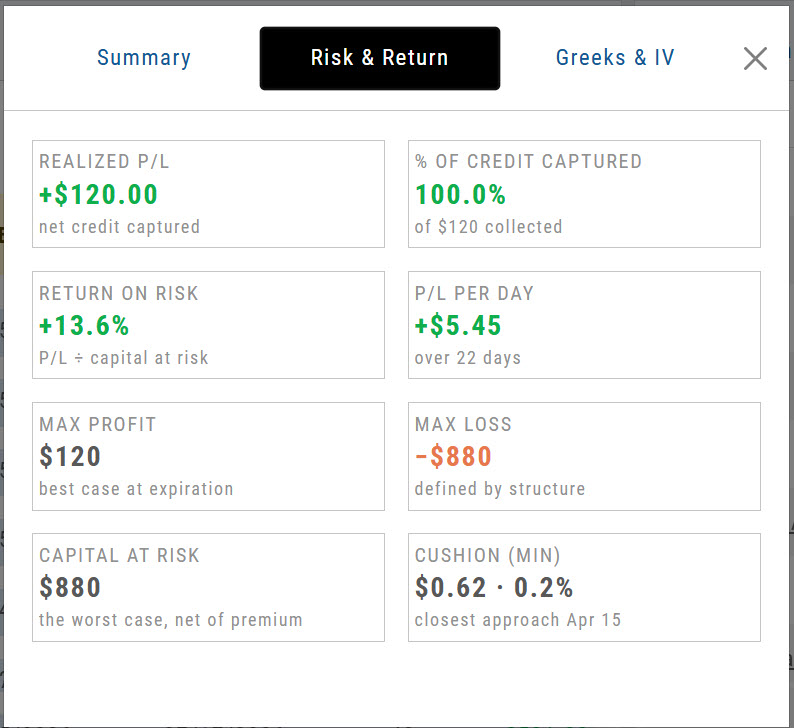
Risk & Return
For this $10 bull put spread: max profit $120 against max risk $880, held 22 days for $5.45 per day and a 13.6% return on risk. Cushion shows how far below the break-even point the trade reached.
Greeks & IV
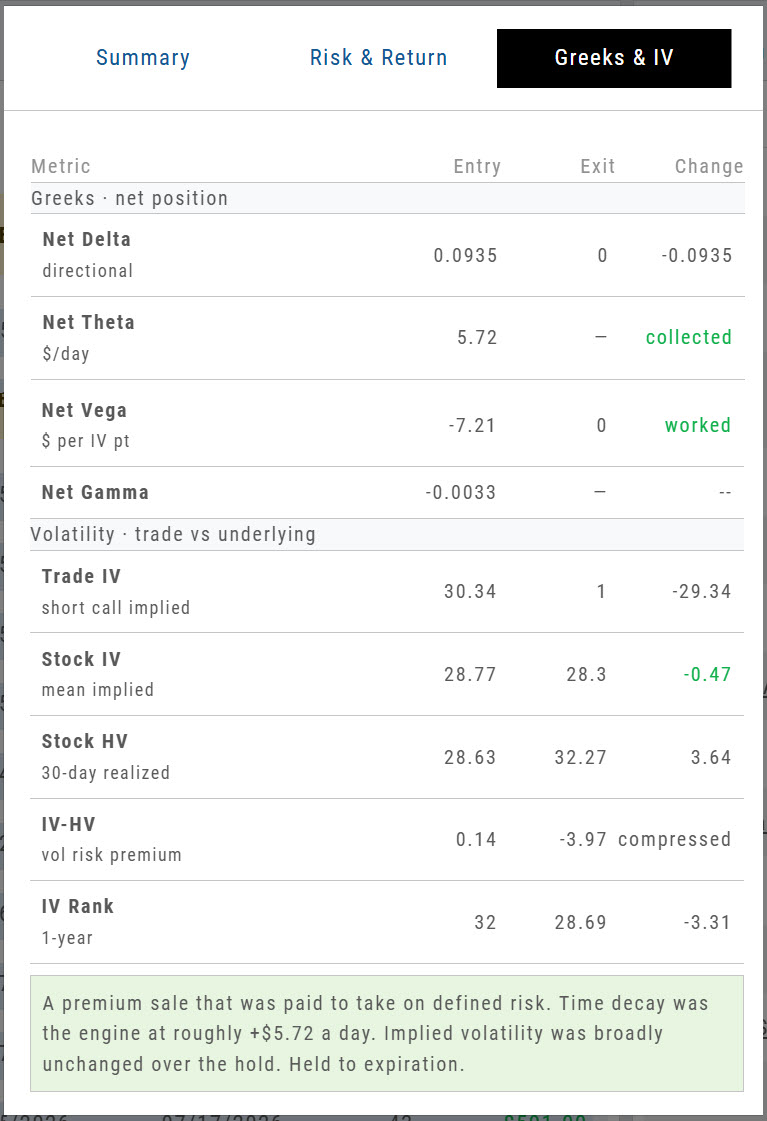
| Metric | What it tells you |
|---|---|
| Net Delta | Directional exposure — roughly what the position gains or loses per $1 move in the stock. |
| Net Theta | Premium in dollars per day that the position collects or pays for each day it is held. |
| Net Vega | What the position gains or loses per one-point change in implied volatility. |
| Net Gamma | How fast Delta itself moves as the stock moves — negative for credit spreads and short premium. |
| Trade IV | The implied volatility of your own legs — what you actually sold or bought. |
| Stock IV | The underlying's mean implied volatility, with 30-day historical volatility shown beneath it. |
| IV − HV | Volatility risk premium — how far implied sat above or below what the stock has actually been doing. |
| IV Rank | Where implied volatility sat within its own one-year range, 0–100. |
Strategy Metrics on the Option Chain
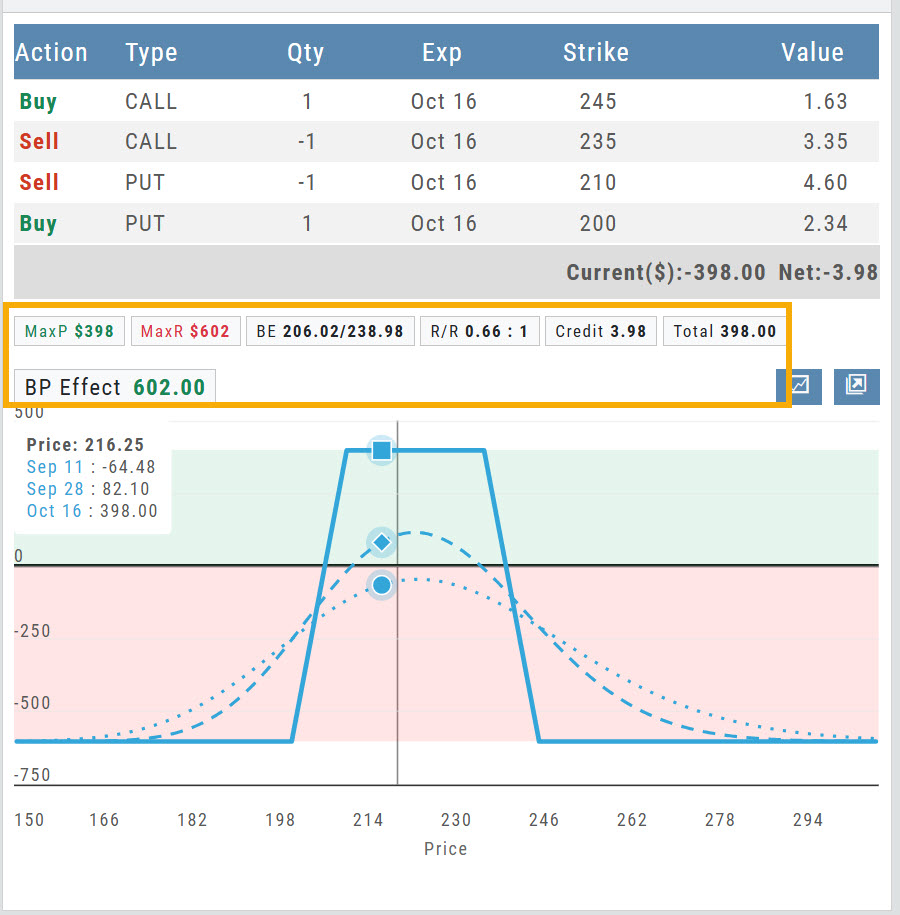
Build a multi-leg strategy on the Option Chain and the figures that decide whether it is worth taking are calculated as you go.
The callout bar sits directly beneath the legs and recalculates as you add, remove or reprice them — so you can weigh a structure before committing to it. Below it, the payoff diagram plots profit and loss across the price range, with a separate curve for each date between today and expiration.
What the callout bar reports
| Field | What it shows | This example |
|---|---|---|
| MaxP | Maximum profit — the most the position can make. | $398 |
| MaxR | Maximum risk — the most it can lose. | $602 |
| BE | Breakeven price on each wing, lower and upper. | 206.02 / 238.98 |
| R/R | Reward measured against risk. | 0.66 : 1 |
| Credit | Net premium received — shown as Debit when you pay to enter. | 3.98 |
| Total | Cost to enter the trade; here, the credit collected. | 398.00 |
| BP Effect | Buying power the position ties up while it is open. | 602.00 |
Reward/Risk on the Order Ticket
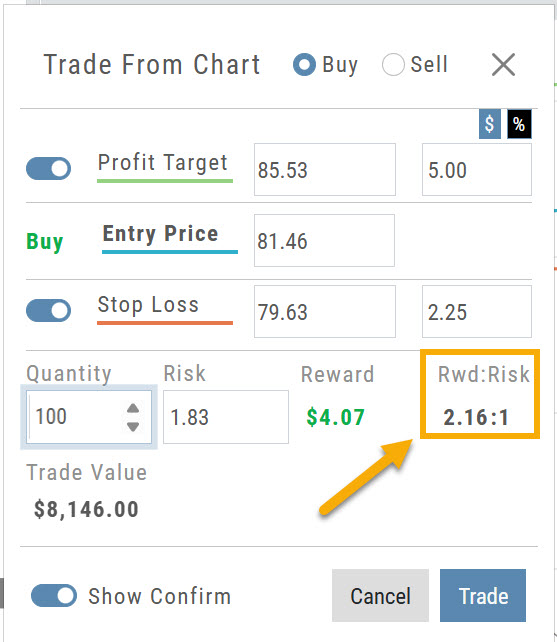
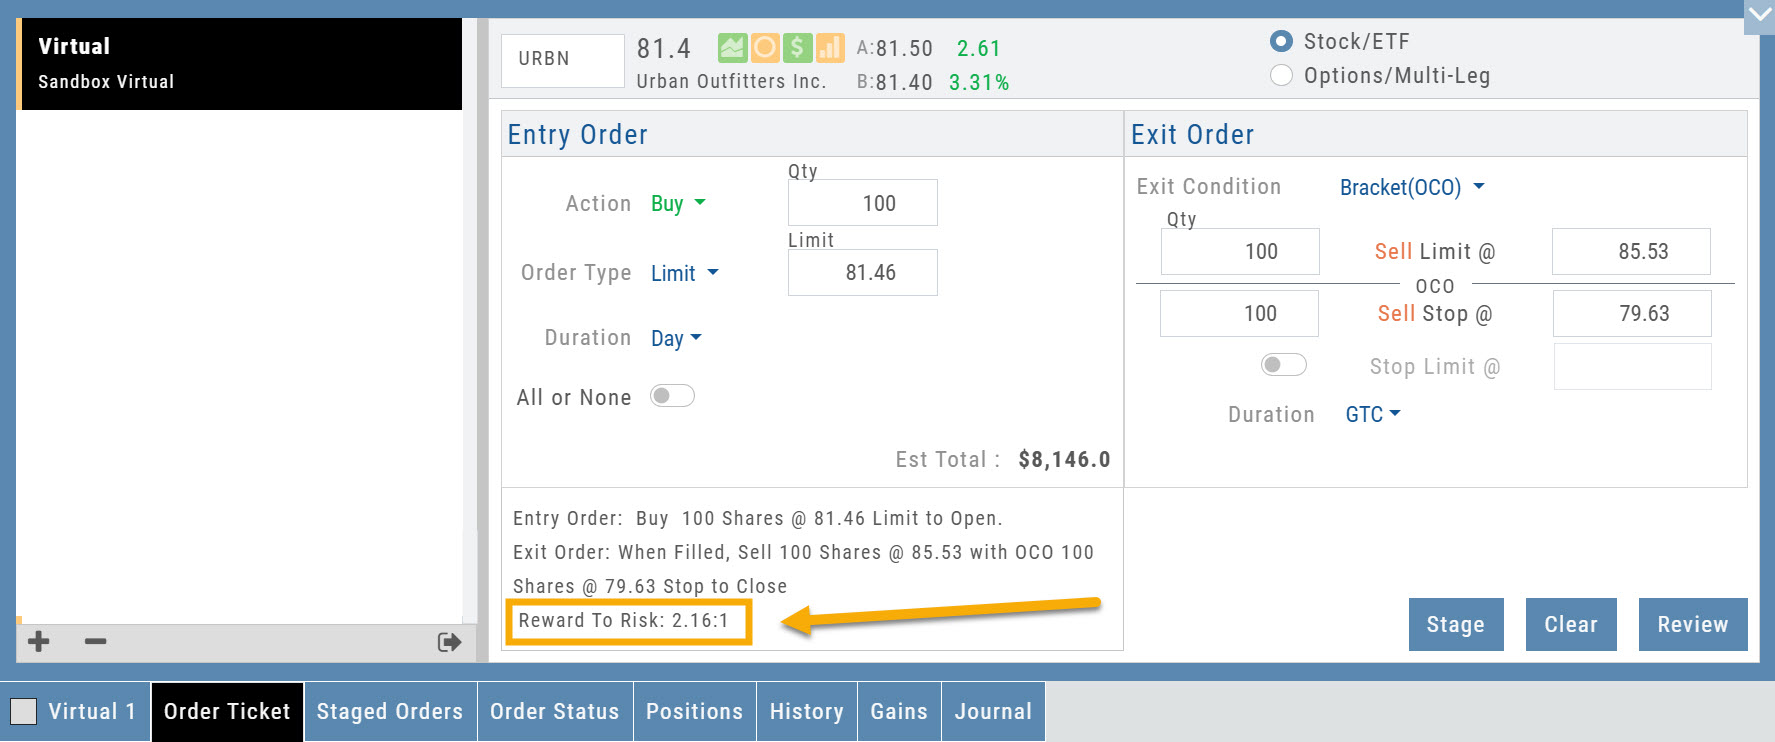
The Reward/Risk ratio you set from the chart now carries through to the Order Ticket, so it stays in view while you finalize the order.
Set it from the chart
Click Trade from the chart to set up a Bracket Order. Set a Profit Target and Stop Loss around your entry price, and the dialog reports the resulting Risk, Reward and Rwd:Risk.
Then finalize on the ticket
The Order Ticket now carries that same figure as Reward To Risk, printed with the order summary — so it stays in front of you while you review, stage or submit, rather than being left behind on the chart.
Almost Real Virtual Accounts
Built from the ground up to give you the most realistic experience possible.
Our new Virtual Accounts are designed to make practice trading more realistic — from the moment an order fills through expiration, assignment, dividends, and margin calculations. Whether you're learning the platform, testing a strategy, or practicing before putting real money at risk, your Virtual Account now gives you a much better picture of how trades can actually affect an account.
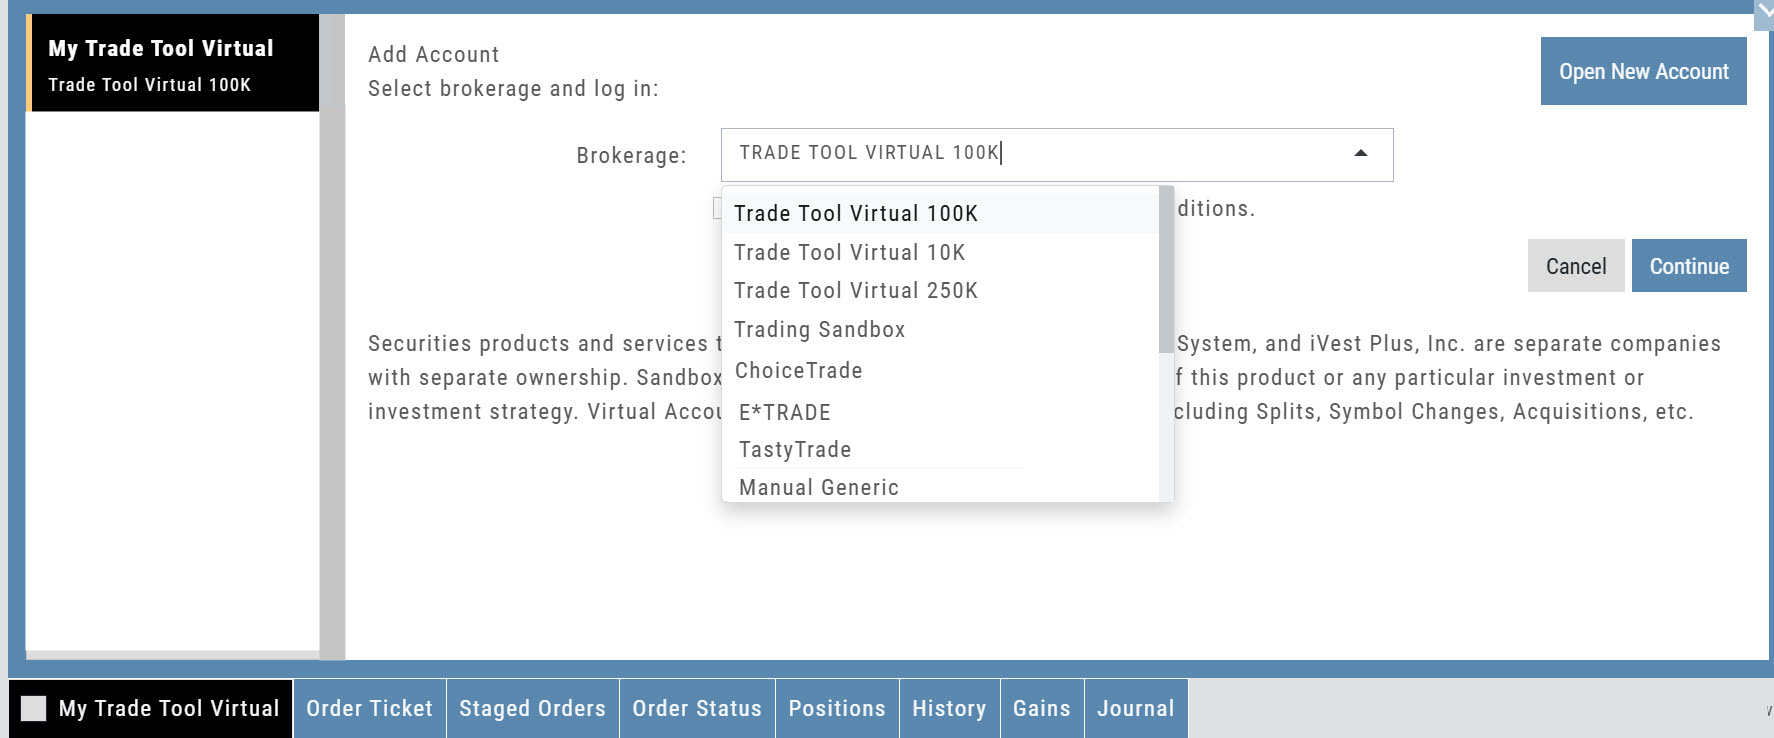
Available starting levels: $10k, $100k and $250k.
What's great about these accounts
- Realistic Fills — fast, market-based fills with potential price improvement, even on spreads.
- Accurate Margin & Buying Power — Reg-T margin and buying power are recalculated as your positions and orders change. Margin Interest is calculated at 10% for impact when used.
- Option Expiration & Assignment — options expire, exercise, and assign as they would in a live account, including cash-settled index options.
- Dividends — eligible positions now reflect dividend activity.
- Realistic Account Outcomes — margin calls, reduced buying power, and negative equity can occur when market conditions warrant them.
Change Log
- FixedTrend Drawing Tool — adjusting a drawn trend line.
- FixedRectangle Annotation — functionality restored.
- FixedLine Cloning — thickness now carries through to the cloned line.
- FixedPrice Slices — Tab key behavior.
- FixedScan Filters — filters now clear.
- ChangedBracket Orders — now function and display as a single order on the chart.