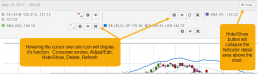
Hovering the cursor over the icons will display it’s function.
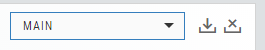
In the upper right of the Chart screen, you can select which Chart Profile to research from the drop-down box, then save or delete the profile.
The next set of icons immediately below this gives more charting capabilities: Increase/Decrease price ranges, Reset price range, Hide/Show Navigation Bar, Move the date Back/Forward, Export/Print Chart
![]()
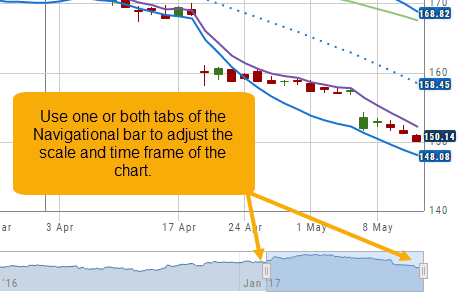
Other features include the Navigation Bar (below the chart). The shaded area corresponds to the chart time period. Slide one or both tabs of the bar to adjust the time period covered.
The “Hide/Show” button near the top-right of the screen will collapse the Indicator Detail area above the chart.