Broad Market Insight that allows you to drill down
The Heat Maps are accessible in the Market tab and under Find>Explore and provide powerful visual views of market performance. This feature is designed to adapt to a variety of strategies and outlooks according to your portfolio needs. Select Index and Time Frame using the Action Icons. These can be changed going forward in any map screen.
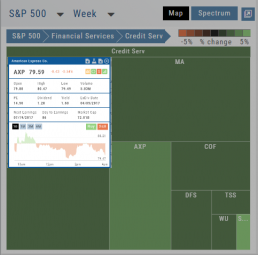
In the Map view, each box represents either an industry group (default) or a stock when you drill down. The size of the box represents the market cap. By hovering your cursor over each box, an info box appears with info on that group within that industry, including the the number of companies, Market Cap, % Change in selected time frame.