Heat Map


Platform Features Release: Annotation Enhancements, Condor Trade Set Up
Announcing the latest Release of Annotation improvements and Strategy template adjustment. We’ve also made several practical changes for better access [...]
Posted in Bug fixes, annotations, Release Notes, Functionality, Charts, Heat Map, Options - Strategies
Tagged zoom feature, price slices, legend, Annotations, strategy templates, chart
Leave a comment
Create Watchlists from Spectrum View
Spectrum View can be used to create or add Watchlists 1. Select the Group, Operator and Time Period Example: Optionable, [...]
Posted in Location, Find, Functionality, Find, Heat Map
Tagged sectors, industries, heat map, spectrum map, views, watchlist, filter
Leave a comment
Heat Map & Spectrum Overview
Broad Market Insight that allows you to drill down The Heat Maps are accessible in the Market tab and under Find>Explore and [...]
Posted in Market, Explore, Find, Heat Map
Tagged navigation, menu, How to, heat map, find
Leave a comment
Industry Performance Bar Chart
The Bar Chart is located on the Market Tab and updates dynamically with selected Heat Map Index and Time Frame. [...]
Go Big – Graphs & Charts
Anywhere you see the ‘Go Big’ icon , you can expand the graphic and access additional information. The Chart Tab under [...]
Posted in Heat Map, Options - Overview
Tagged graphs, navigation, menu, How to, icons, heat maps, volatility
Leave a comment
The Legend – Heat and Spectrum Maps
The Legend shows the range of % negative or positive change represented by a color spectrum. It is important to [...]
Heap Map View
Each box in the Map View represents either an industry group or a stock when you drill down. The size of [...]
Spectrum Map View
In the Spectrum view, each column represents the slice of time selected: Day, Week, Month or Trailing Quarter. Once the [...]
Heat Map Data Points
Drop-down menus allow you to select Index, Time Frame and various Data Points. Choose among % Change, Dividend Yield, PEG, [...]
52 Week High/Low Value
The 52 Hi/Low Value represents the current percentile of the stock (or sector) relative to it’s 52 week high/low price [...]
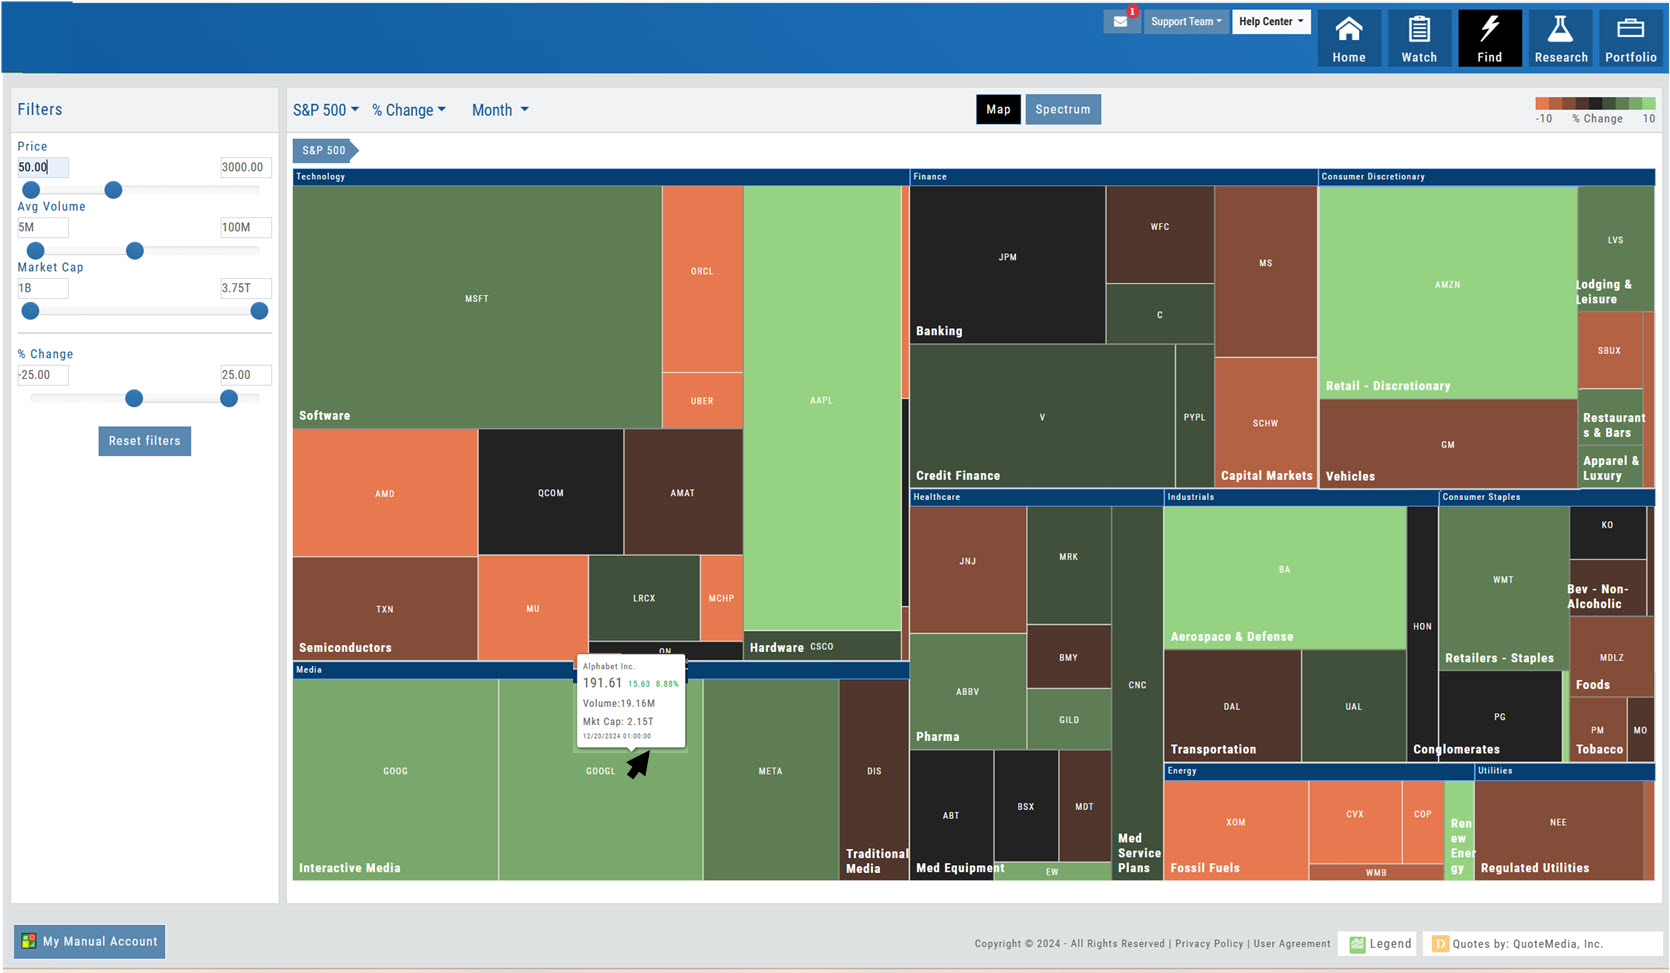
Heat Map Filters
Bonus! The Platform remembers your Preferences! Select the view you like and it will be saved during your current session [...]
Posted in Explore, Heat Map
Tagged menu, How to, heat map, filters, spectrum, navigation
Leave a comment
Quote Detail without leaving the List
A quick snapshot of a stock with navigational tools. The Action Arrow Icon will provide a pop-up Quote Detail window [...]
Explore – Give it a try!
From finding the best stock in the best sector to following where the money is flowing to and from, Heat [...]
Posted in Market, Location, Uncategorized, Heat Map
Tagged navigation, menu, How to, heat maps, spectrum map
Leave a comment